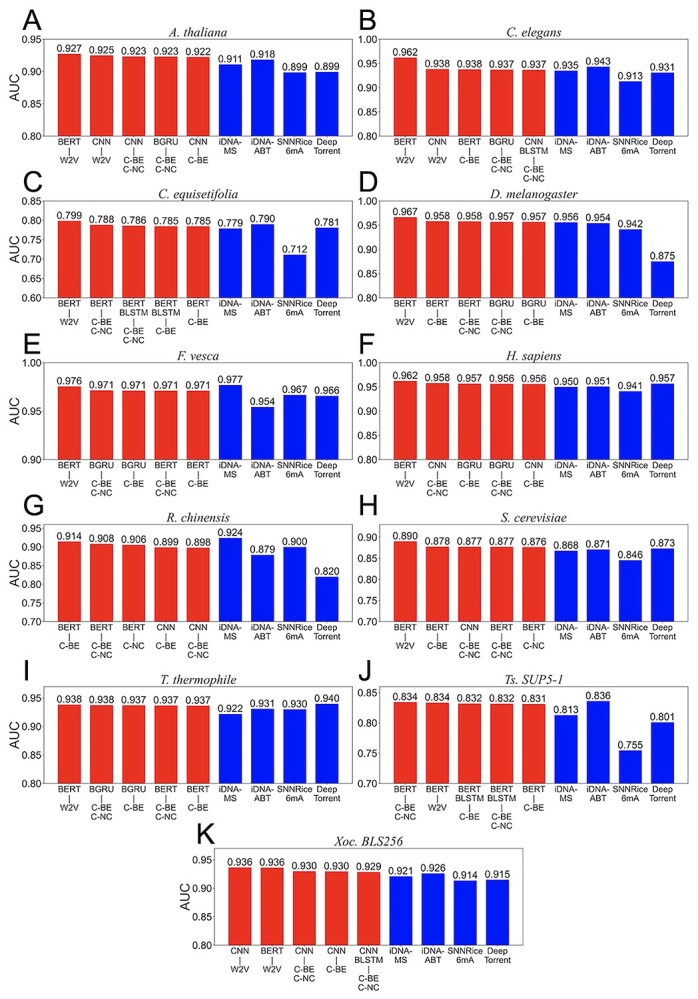
Figure 2.

Performance comparison of deep learning and machine learning approaches in the independent test. The bar plots show AUCs of five deep learning-based methods with higher area under the curves (red bar) and previous models (blue bar) for 11 species including Arabidopsis thaliana (A), Caenorhabditis elegans (B), Casuarina equisetifpolia (C), Drosophila melanogaster (D), Fragaria vesca (E), Homo sapiens (F), Rosa chinensis (G), Saccharomyces cerevisiae (H), T. thermophile (I), Ts. SUP5–1 (J) and Xoc. BLS256 (K). W2V, C-BE, C-NC, BE, NC, BE+NC and C-BE+C-NC correspond to word2vec, contextual-binary encoding, contextual-NCPNF, binary encoding, NCPNF, combination of binary encoding and NCPNF, and combination of contextual-binary encoding and contextual-NCPNF, respectively. BERT, LSTM, GRU, BLSTM, BGRU, CNN, BERT+BLSTM, CNN+BLSTM correspond to BERT, LSTM, GRU, Bi-LSTM, Bi-GRU, 1D-CNN, BERT with Bi-LSTM and 1D-CNN with Bi-LSTM. The performances of the previous models were provided from Table S3, available online at http://bib.oxfordjournals.org/, of Lv et al.’s paper (iDNA-MS) and Table S2, available online at http://bib.oxfordjournals.org/, of Yu et al.’s paper (iDNA-ABT).
