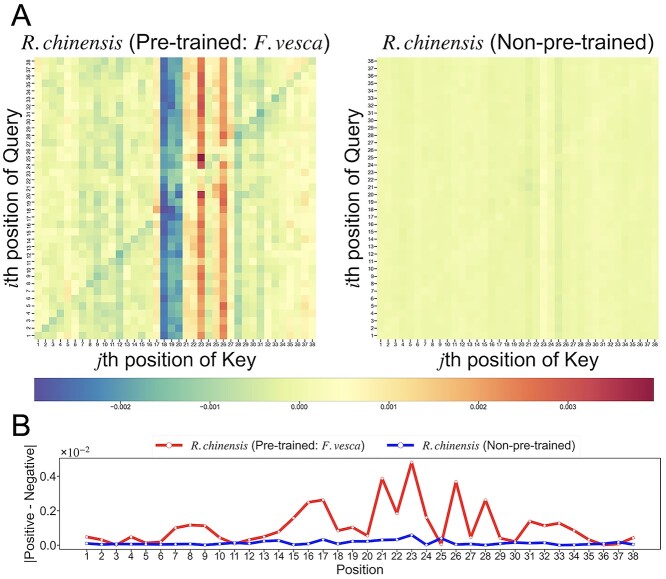
Figure 8.
Visualization of the deviation in attention maps and the differences in the averaged position weights between positive and negative samples. (A) Heatmap of the deviation in the averaged attention maps. The attention weight at position (i, j) was the softmax-normalized dot product of the ith positional vectors of the query and the jth positional vectors of the Key. The averaged attentions were calculated in the independent tests of the Rosa chinensis-fine-tuned, Fragaria vesca-pretrained model (left) and the R. chinensis-trained model without any pretraining (right). The horizontal bar indicates the deviations of the averaged attention map. (B) The differences in the averaged position weights between the positive and negative samples were calculated for both the models: the R. chinensis-fine-tuned, F. vesca-pretrained model (red line) and the R. chinensis-trained model without any pretraining (blue line).

