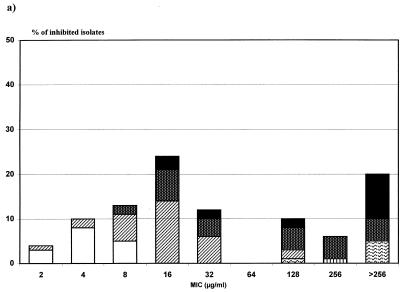
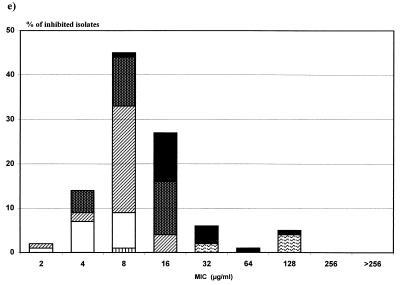
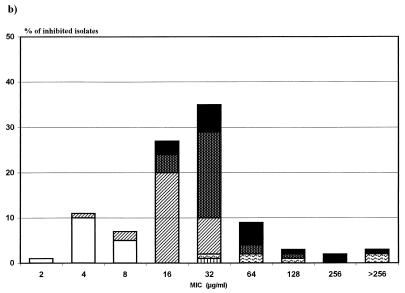
FIG. 1.
Comparative distributions of ampicillin-sulbactam (a and
b) and amoxicillin-clavulanate (c, d, and e) MICs for E.
coli isolates with different β-lactam susceptibility phenotypes.
□, S; ▨, TL; ▩, TI; █, TH-IRT; ▥, ESβL;
 , CP. (a) Ampicillin-sulbactam
agar dilution (fixed concentration, 8 μg/ml). (b)
Ampicillin-sulbactam agar dilution (fixed ratio, 2:1). (c)
Amoxicillin-clavulanate agar dilution (fixed concentration, 2 μg/ml).
(d) Amoxicillin-clavulanate agar dilution (fixed concentration, 4
μg/ml). (e) Amoxicillin-clavulanate agar dilution (fixed ratio,
2:1).


