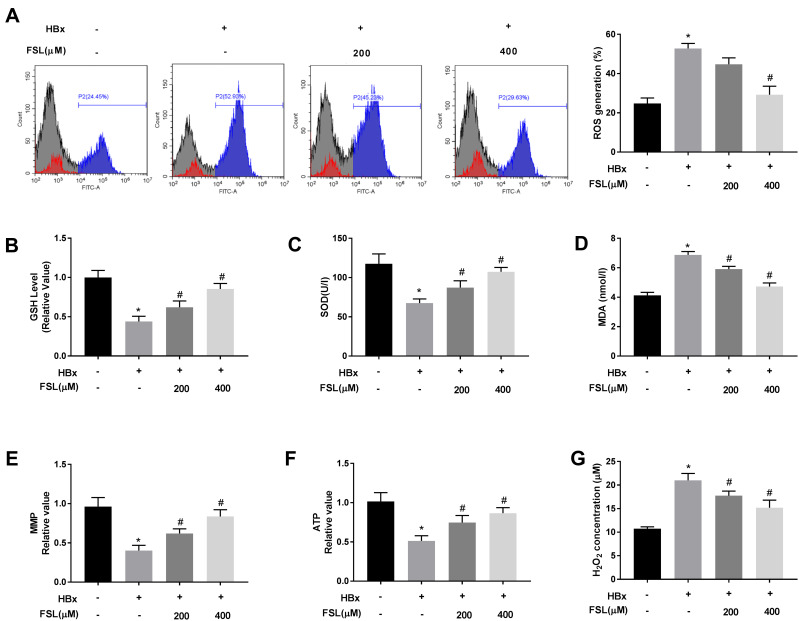
Figure 3.
Suppression of PAR2 attenuates HBx-induced mitochondria oxidative stress in LO2 cells. (A) ROS generation assay was performed using flow cytometry analysis. (B) The level of GSH in LO2 cells under different treatments. (C) The level of SOD in LO2 cells under different treatments was measured by a commercial kit. (D) The level of MDA in LO2 cells under different treatments was measured by a commercial kit. (E) MMP value in LO2 cells under different treatments. (F) ATP value in LO2 cells under different treatments. (G) H2O2 concentration in LO2 cells under different treatments. *P < 0.05 vs the HBx(-) + FSL(-) group. #P < 0.05 vs the HBx(+) + FSL(-) group. The experiments were performed in triplicate.

