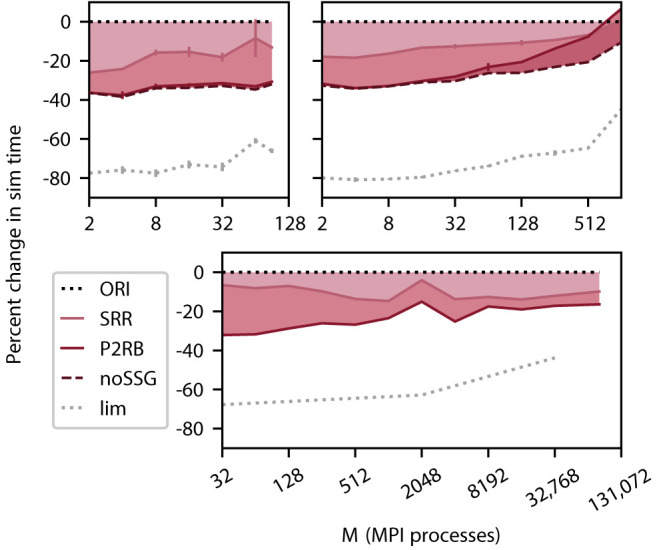
Figure 4.

Cumulative relative change in simulation time after a redesign of spike delivery as a function of the number of MPI processes M. Top left panel DEEP-EST CM and top right panel JURECA CM: linear-log representation for a number of MPI processes M∈{2; 4; 8; 16; 32; 64; 90} and M∈{2; 4; 8; 16; 32; 64; 128; 256; 512; 1024}, respectively. Weak scaling of benchmark network model with the same configuration as in Figure 3; error bars show SD based on 3 repetitions. Bottom panel K computer: number of MPI processes M∈{32; 64; 128; 256; 512; 1024; 2048; 4096; 8192; 16, 384; 32, 768; 82, 944}, gray dotted curve: M∈{32; 2048; 32, 768}. Weak scaling with different configurations (1 MPI process per compute node; 8 threads per MPI process; 18, 000 neurons per MPI process). The black dotted line at zero indicates the performance of the original code (ORI, Section 2.3). The light carmine red curve indicates a change in sim time (shading fills area to reference) due to sorting of spike entries prior to delivery (SRR, Section 4.1). The dark carmine red curve indicates an additional change in sim time due to providing synapses with direct pointers to neuronal spike ring buffers (P2RB, Section 4.2). The dashed brown curve shows an additional change in sim time after removal of an unrequired generic function call (noSSG). Gray dotted curve indicates a hypothetical limit to the decrease in sim time assuming spike delivery takes no time.
