
Figure 5.
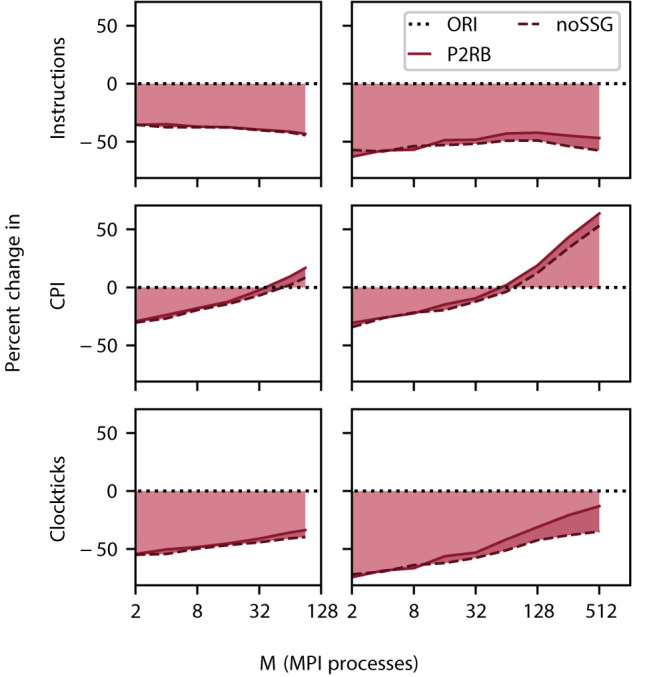
Relative change in instructions retired (top row), clockticks per instruction retired (CPI, middle), and clockticks (bottom) during spike delivery for P2RB (including SRR as in Figure 4), and noSSG as a function of the number of MPI processes. Raw data for all three quantities was obtained by VTune (Section 3.4.1). Left column DEEP-EST CM and right column JURECA CM: linear-log representation for number of MPI processes M∈{2; 4; 8; 16; 32; 64; 90} and M∈{2; 4; 8; 16; 32; 64; 128; 256; 512}, respectively. Black dotted line at zero percent (ORI, Section 2.3) indicates the performance of the original code. Weak scaling of benchmark network model as in Figure 4.