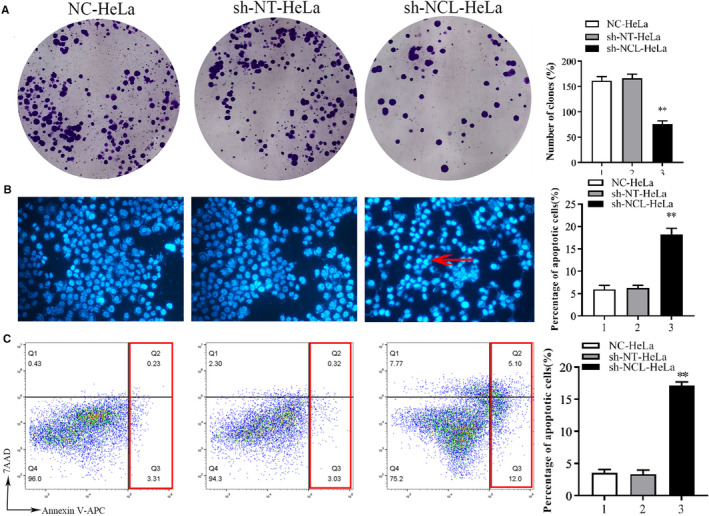
FIGURE 2.

Detection of proliferation and apoptosis of HeLa cells after NCL interference. (A) Colony formation assay. Cells were inoculated into plates at a density of 500 cells per well and grown at 37°C for 14 days. Cell colonies were stained with 0.1% crystal violet (Left). Cell colonies were quantified, **p < 0.01 (right). (B) NCL knockdown induced apoptosis morphological features as shown by Hoechst. Hypercoagulable nuclei and semilunar apoptotic bodies represent typical apoptosis morphology (see the red arrow; fluorescence staining ×400). (C) Cell apoptosis was detected using flow cytometry. Representative flow cytometry analysis of Annexin V‐APC/7AAD staining (left). The apoptosis rate was quantified (right). Mean ± SD from three individual experiments. *p < 0.05, versus the sh‐NT‐HeLa group. NCL, nucleolin
