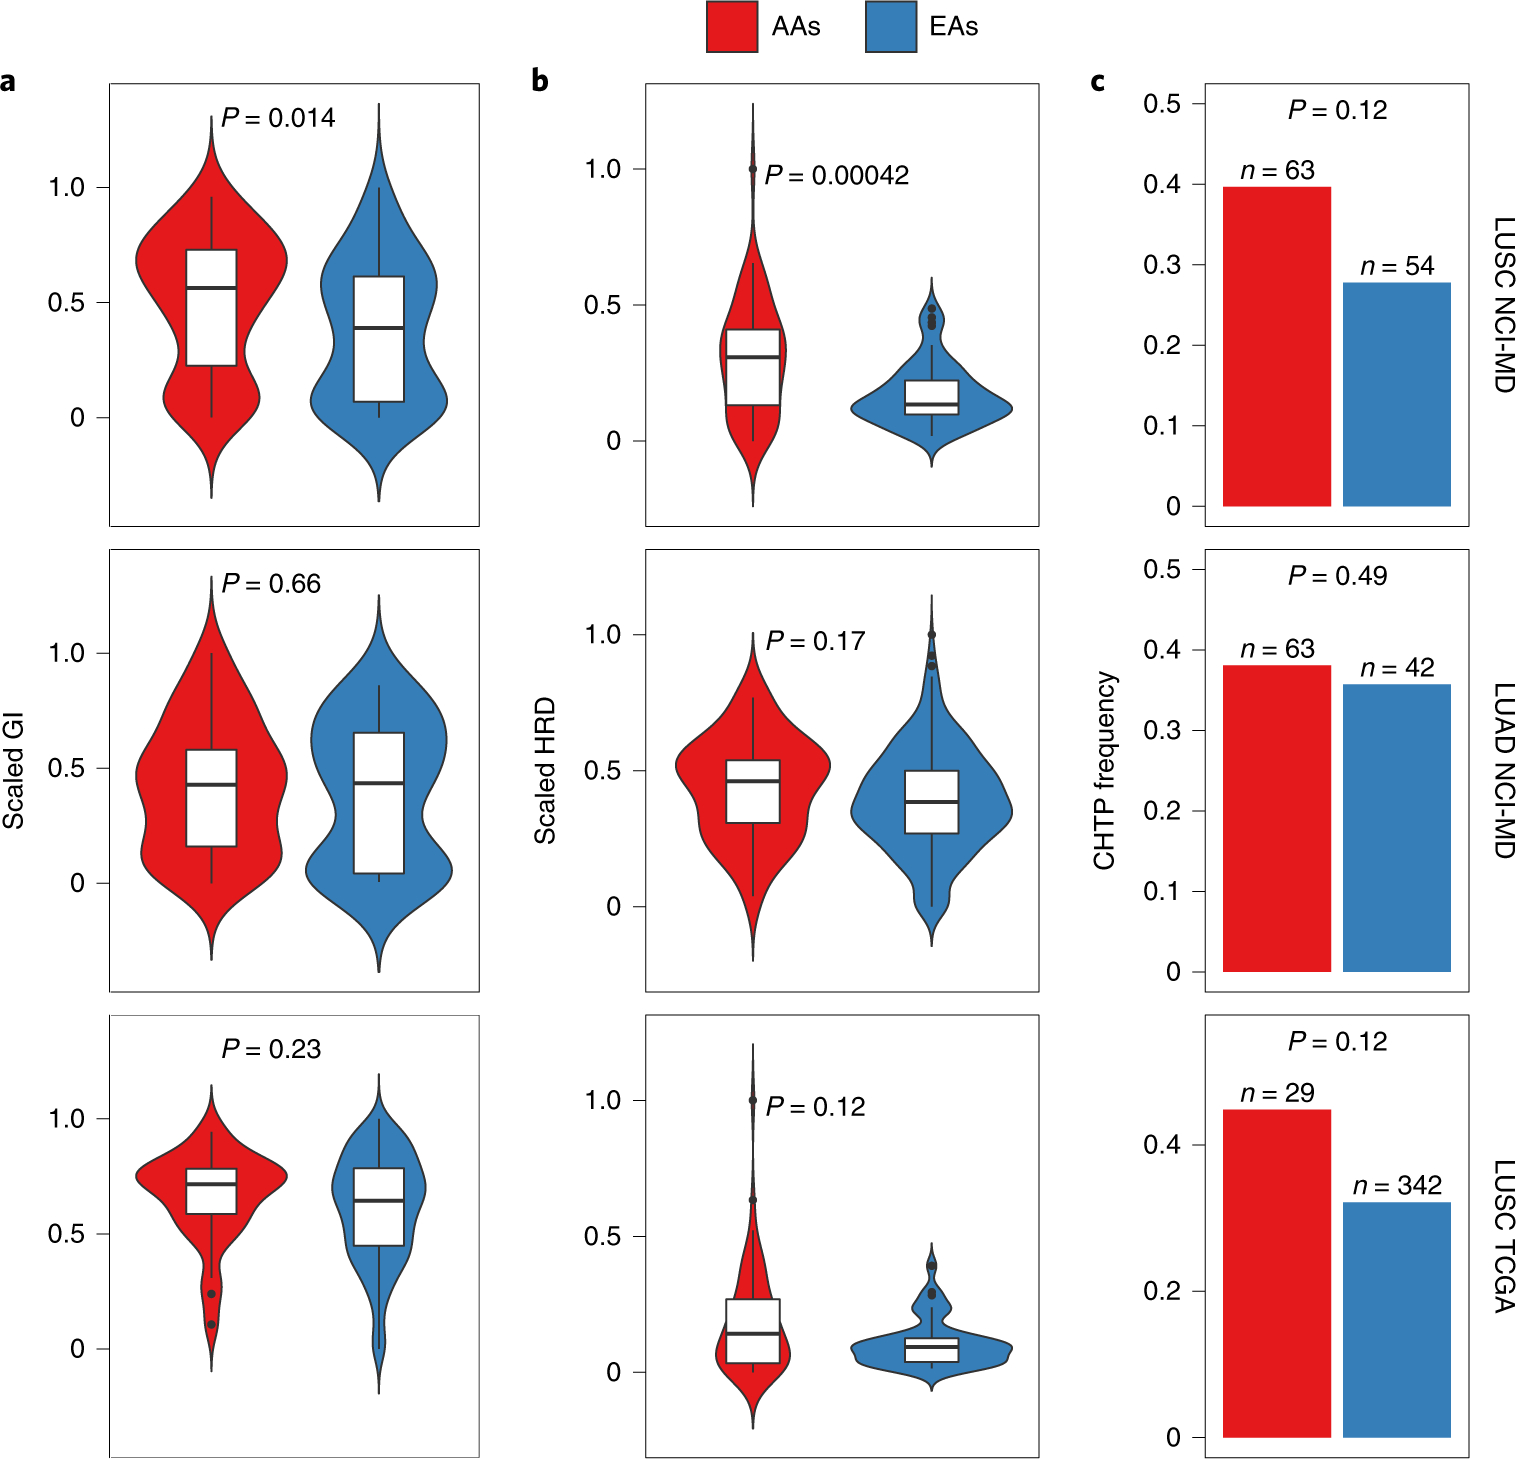
Fig. 1 |. Differences in GI, HRD and CHTP across AA and EA patients with lung cancer from the NCI-MD and TCGA cohorts.

a–c, GI (a), HRD (b) and CHTP (c) are quantified and presented stratified by genetic ancestry for LUSC (top; n = 105 patients (AA = 63; EA = 42)) and LUAD (middle; n = 117 patients (AA = 63; EA = 54)) from the NCI-MD cohort, and LUSC from the TCGA cohort (bottom; n = 375 patients (AA = 29; EA = 346)). Significance for comparison of medians in a and b was calculated by one-sided Wilcoxon rank-sum test. Significance for comparison of frequency in c was calculated by one-sided Fisher’s exact test. The violin plots in a and b show the data distribution, where the center line denotes the median, the box edges show the interquartile range and the black line represents the rest of the distribution, except for points that were determined to be ‘outliers’, which is 1.5 times the interquartile range.
