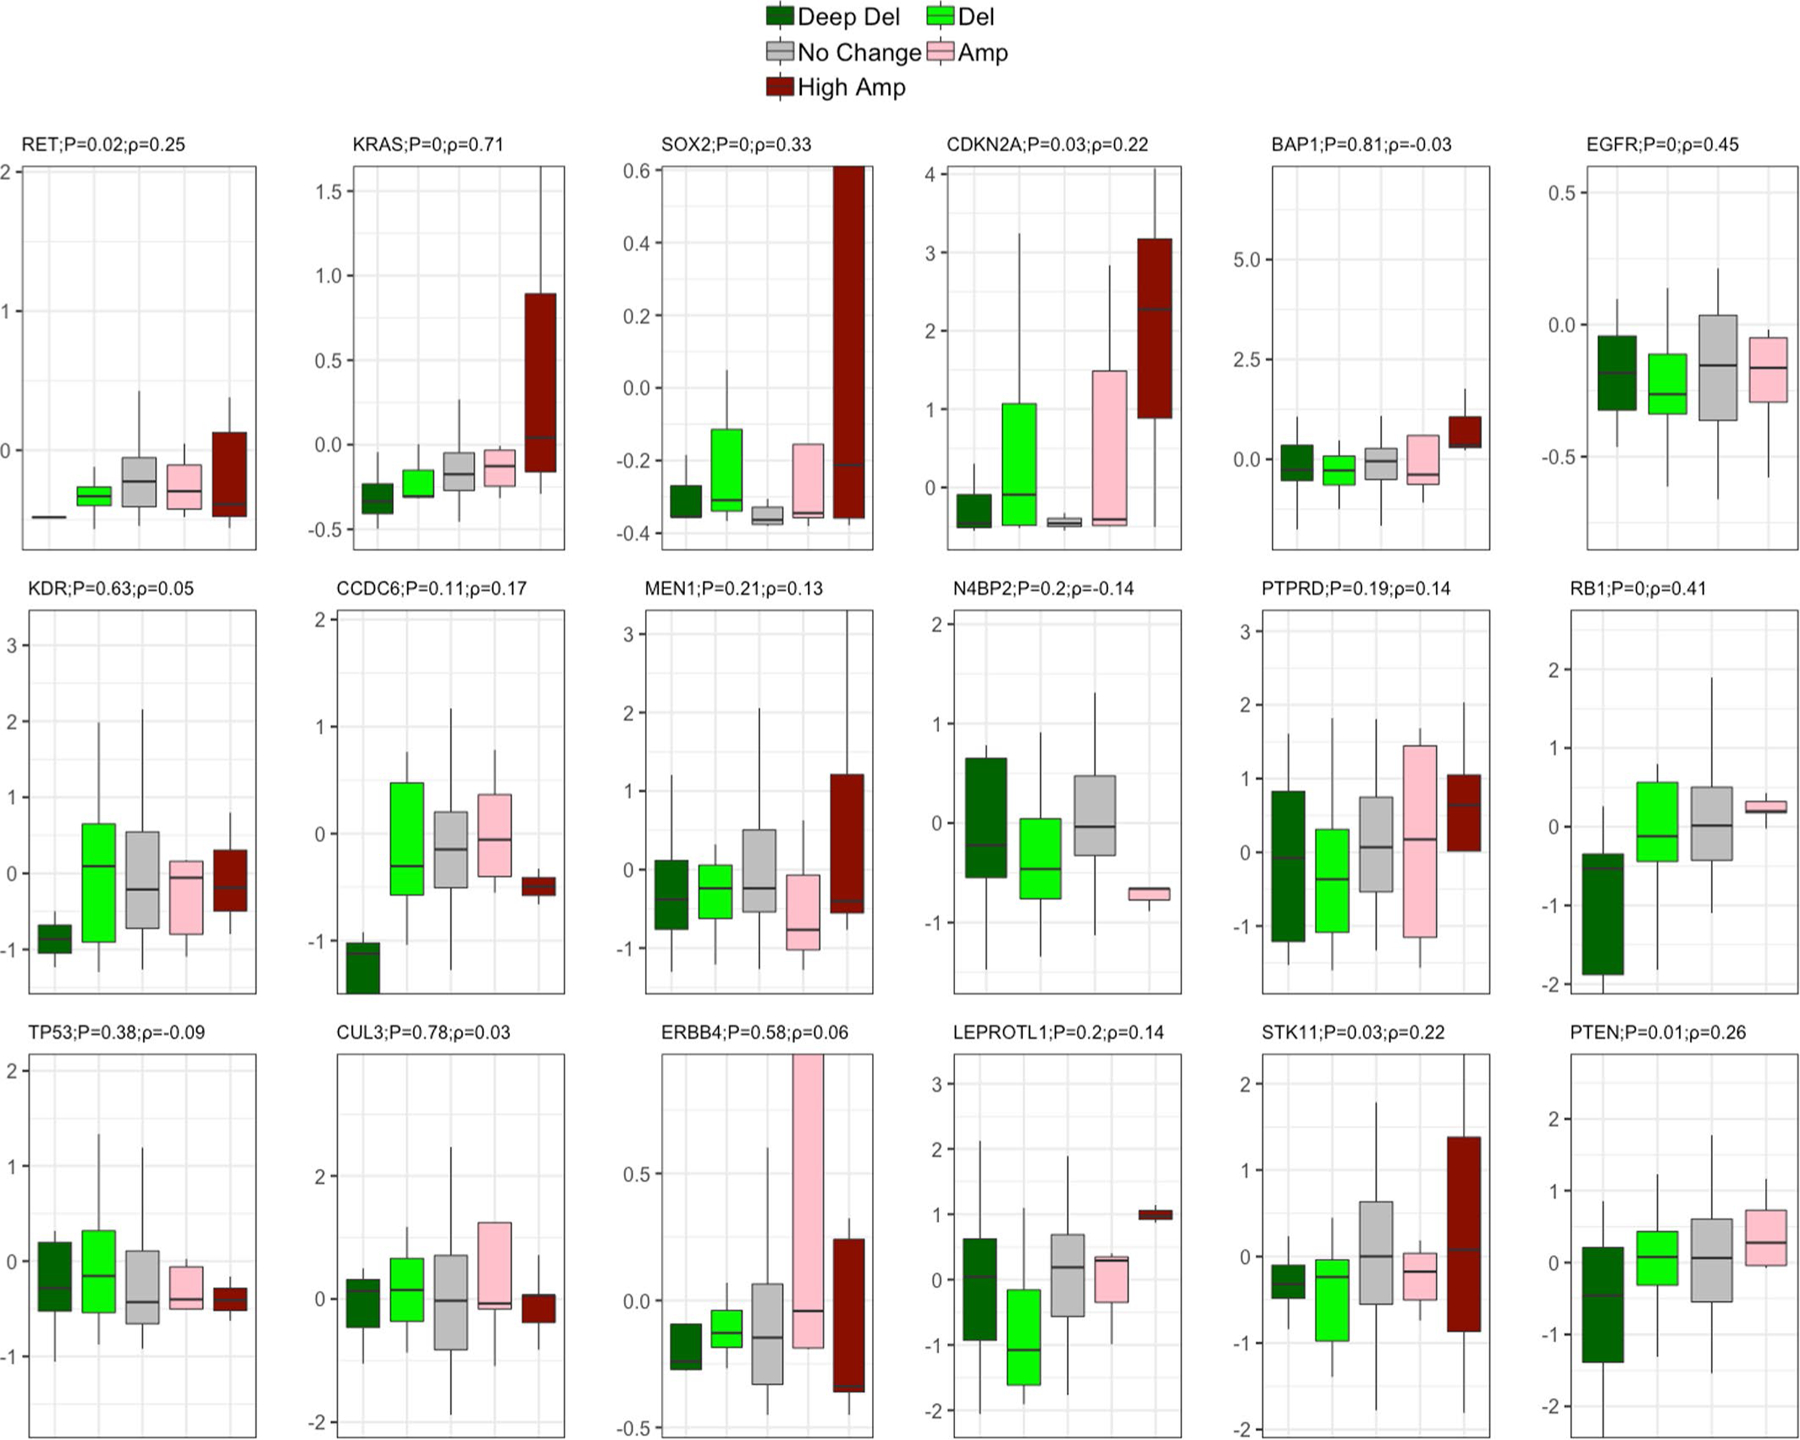
Extended Data Fig. 4 |. Effect of somatic copy number alteration (SCNA) on expression for cancer driver genes in the NCI-MD cohort (n=91 patients).

Effect of SCNA on expression for driver genes is plotted for lung cancer driver genes whose somatic copy number alteration frequency across populations are significantly different. Two-sided Spearman correlation significance with Rho is provided with the corresponding gene name before multiple testing correction. Here, in the box plot, the center line denotes the median, the box indicates the interquartile range and the black line represents the rest of the distribution, except for points that are determined to be “outliers”, 1.5 times the interquartile range.
