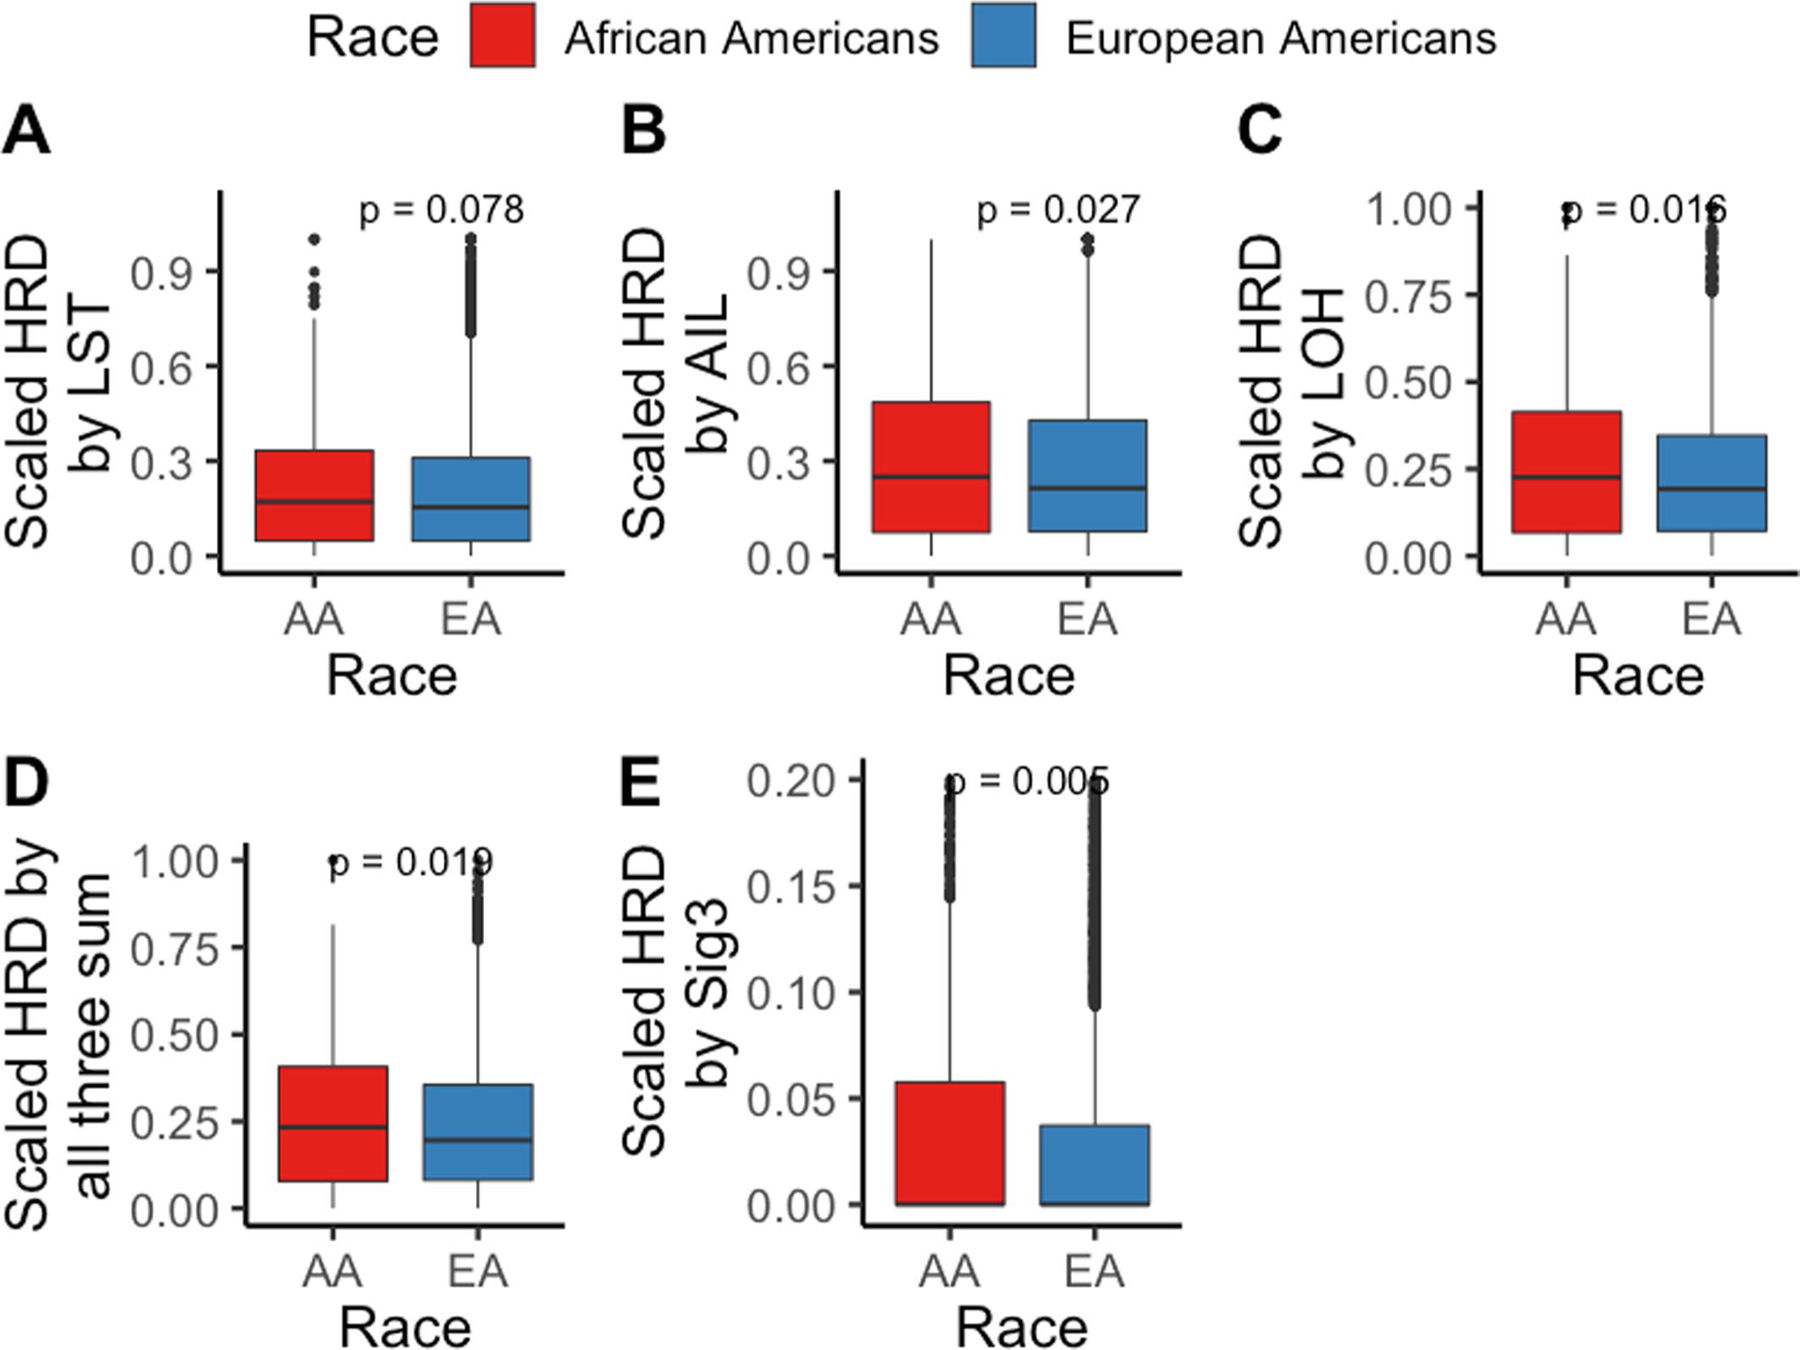
Extended Data Fig. 7 |. Various measures of homologous recombination deficiency (HRD) in pan-cancer in European Americans (EAs) and African Americans (AAs) from The Cancer Genome Atlas (TCGA) (total N=6,966 patients; [AA=770, EA=6,196]).

HRD is quantified and presented via score based on (a) number of Loss of heterozygosity (LOH) events, (b) telomere allelic imbalance (AIL), (c) large-scale state transitions (LST), (d) sum of previous three defined as “genomic scar” and (e) mutation signature 3 contribution. A one-sided Wilcoxon Rank-sum test has been performed to test whether HRD in tumors from AAs is higher than in EAs. Here, in the box plot, the center line denotes the median, the box indicates the interquartile range and the black line represents the rest of the distribution, except for points that are determined to be “outliers”, 1.5 times the interquartile range.
