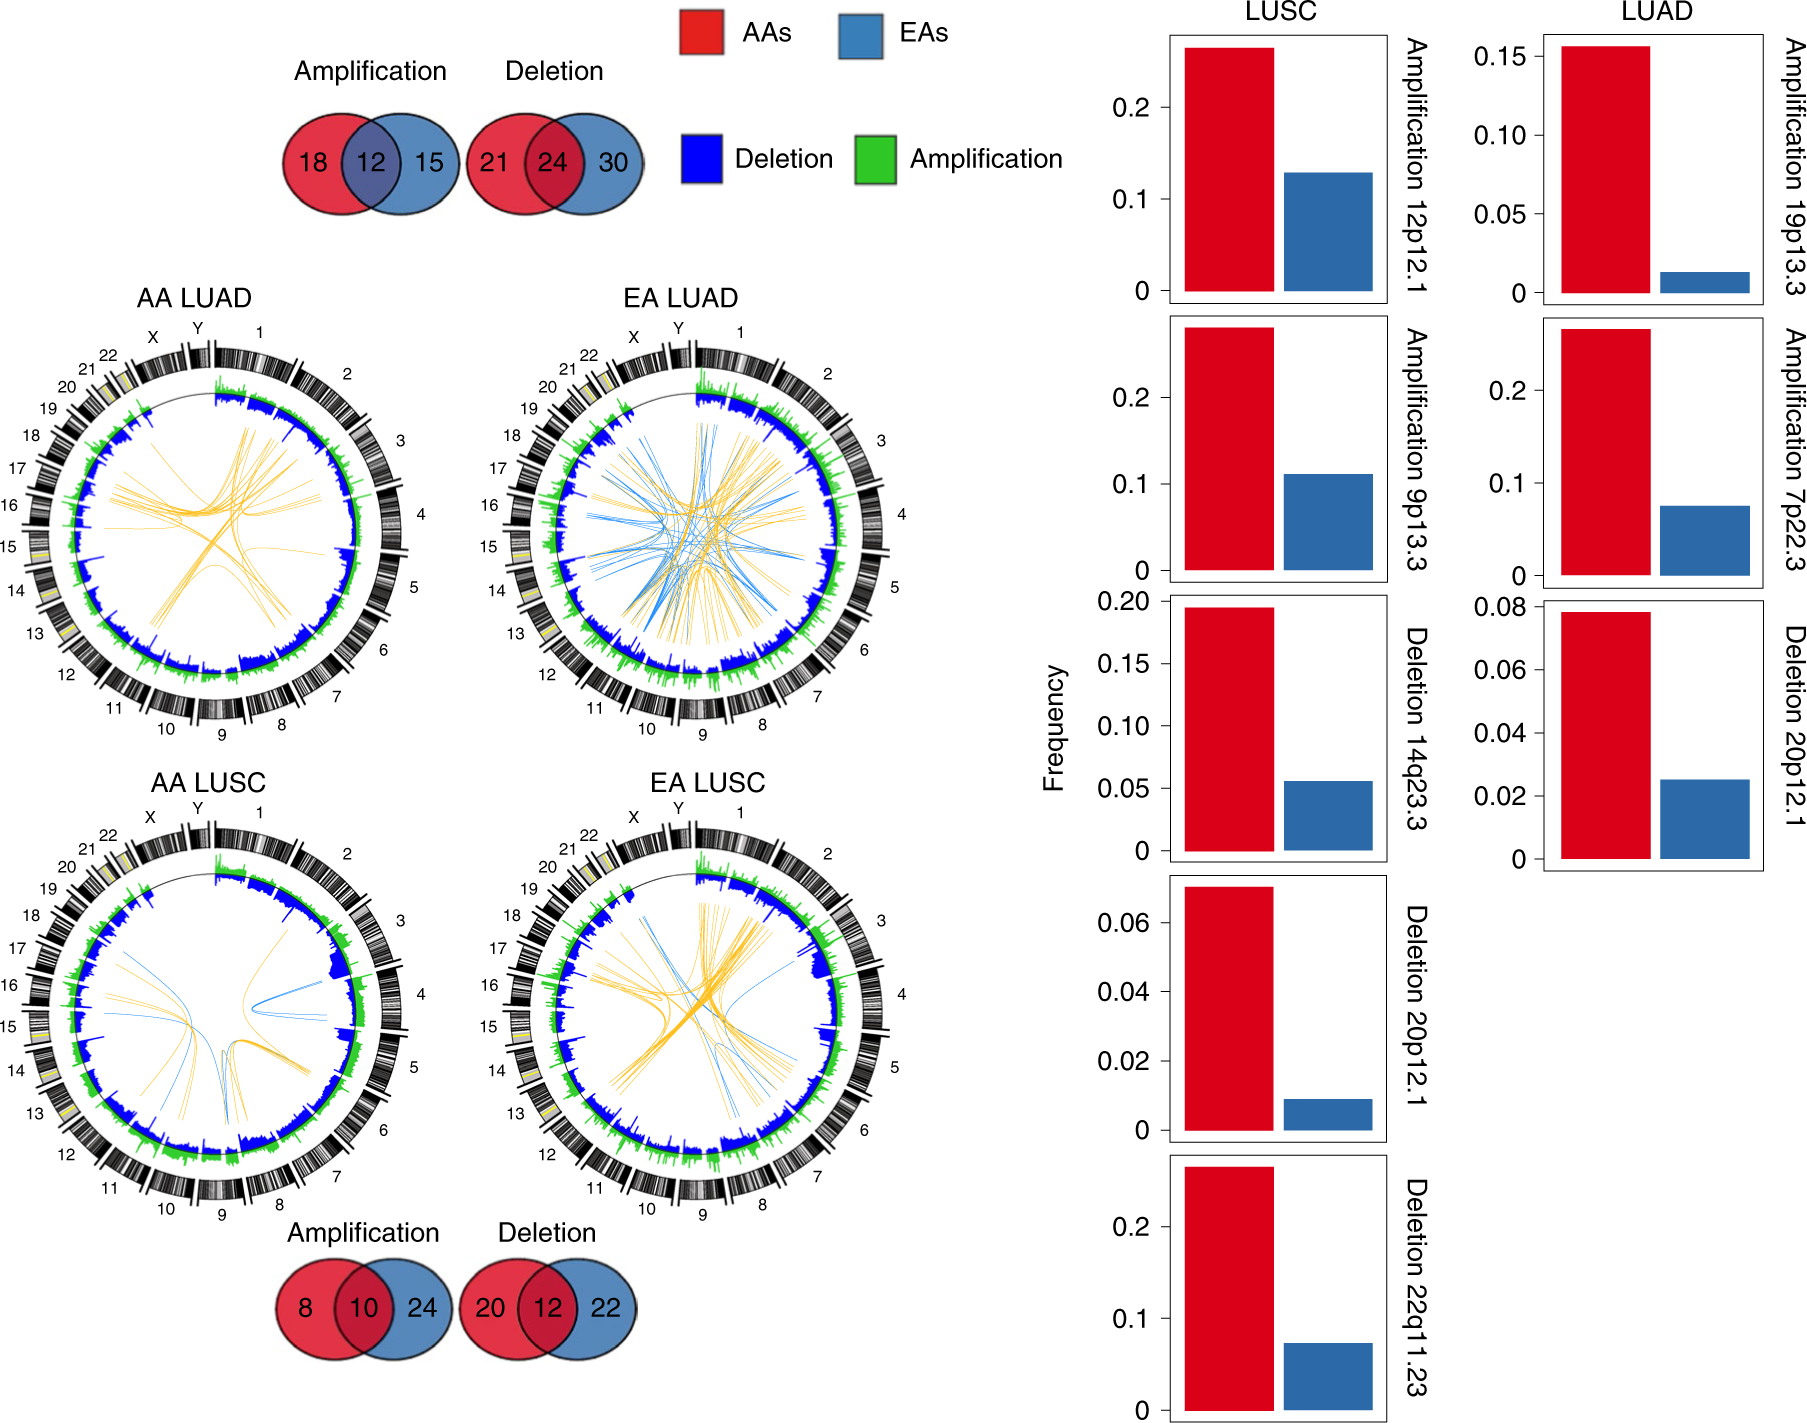
Fig. 3 |. Global SCNA map across AA and EA patients in the NCI-MD cohort.

Segmental deletions and amplifications are shown In blue and green, respectively, in the Circos plots to the left. In these plots, the top 50 (Pearson’s Rho>0.50) highly positively (co-occurring) and negatively (mutually exclusive) correlated copy-number segment pairs are connected with yellow and blue arcs, respectively. The overlap and unique recurrent regions between AAs and EAs in LUSC and LUAD are shown as Venn diagrams at the top and bottom. Regions which are (1) AA-specific recurrent; (2) have a frequency in AAs≥2 × frequency in EAs; (3) have an AA frequency >5%; and (4) no recurrent peak of the same type (amplification or deletion) is present in EAs within the region or an extended additional 10% on both sides of the region length, are considered potential SCNA-driven AA-specific driver regions. For each of the regions that meet these criteria, a bar plot is provided to the right, showing the corresponding frequency in AAs (red) and EAs (blue) for LUSC (left) and LUAD (right). The recurrence significance for each focal region was computed via GISTIC in AAs and EAs separately, with an FDR-corrected significance threshold of 0.1.
