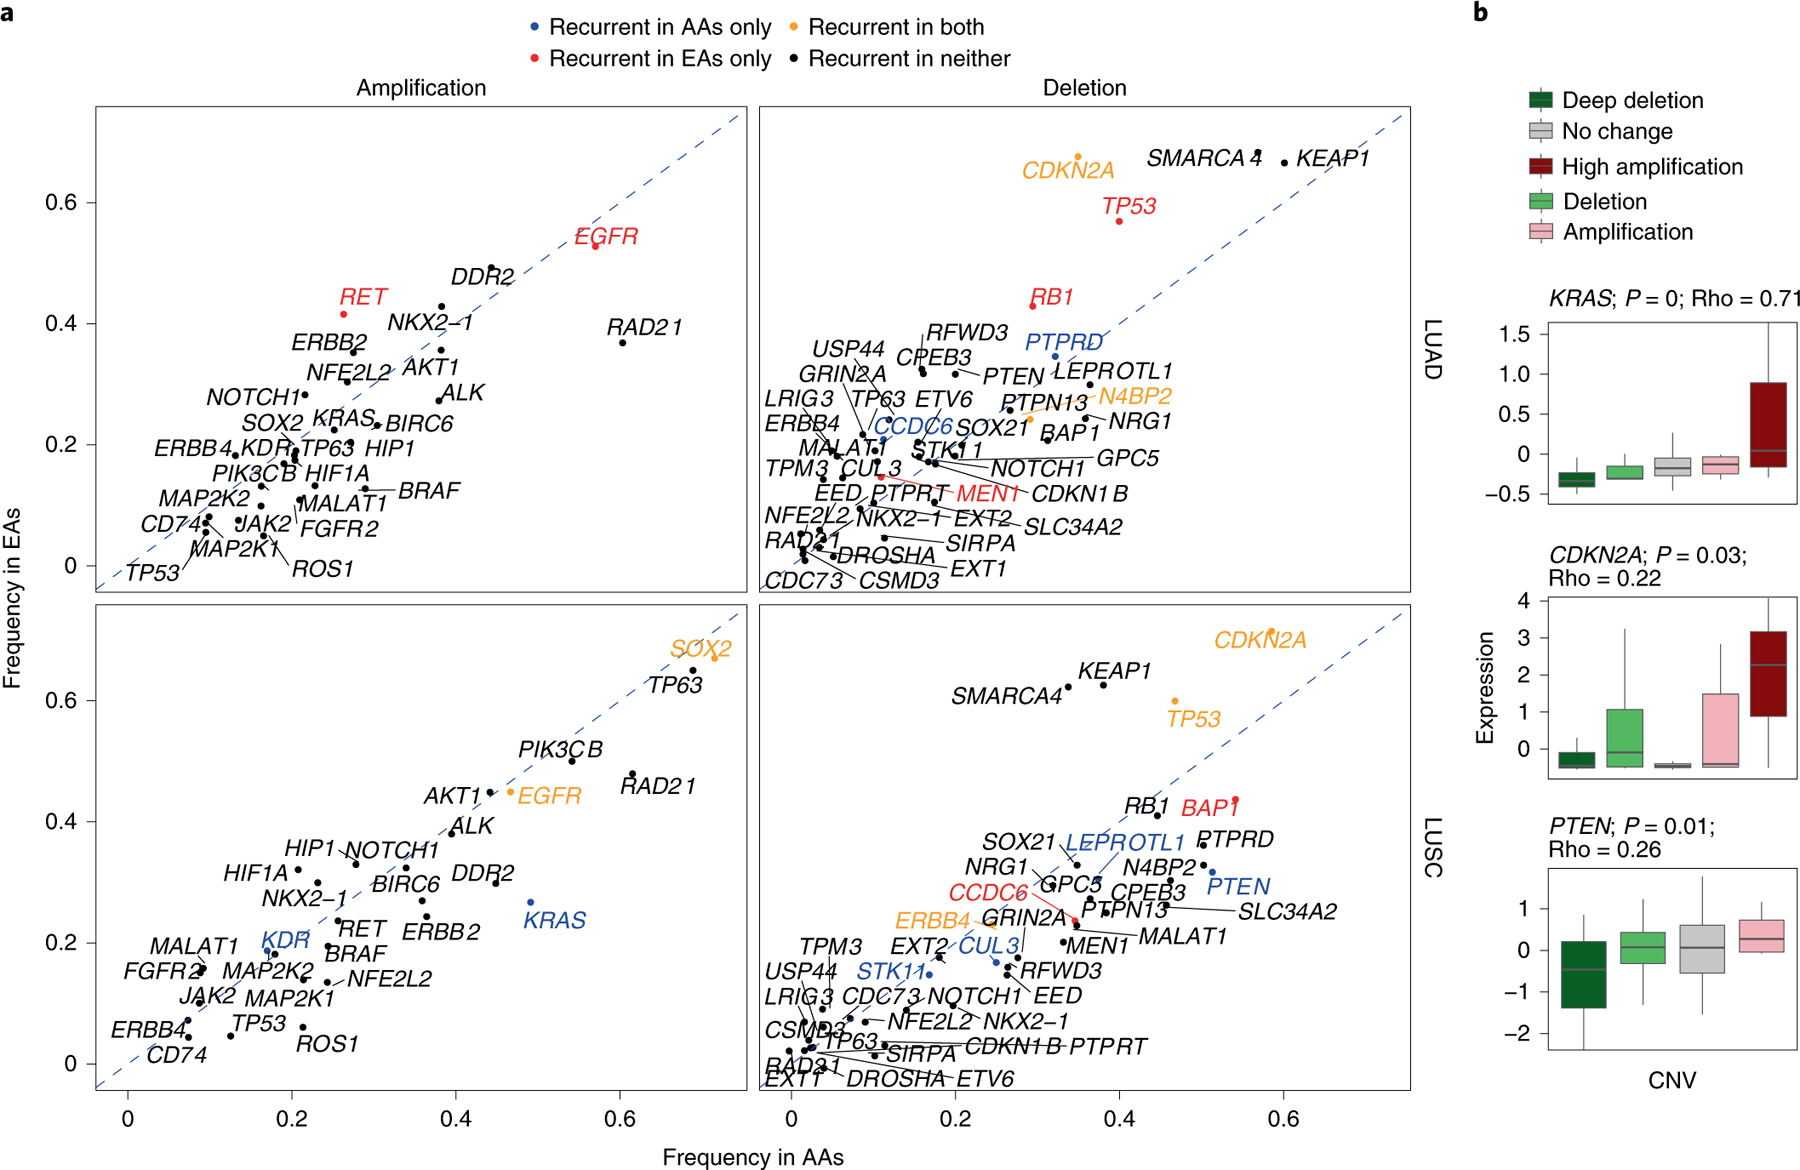
Fig. 4 |. Landscape of SCNA of lung cancer drivers AA and EA patients in the NCI-MD cohort.

a, Amplification and deletion frequencies of lung cancer driver genes across population and histology. The recurrence significance for each gene was computed via GISTIC in AAs and EAs separately, with an FDR-corrected significance threshold of 0.1. The diagonal dashed lines denote the null lines, with points falling away from this line indicating chromosome arms with alteration frequency differences across populations. A color code is provided to denote gene-level population-specific statistically significant recurrent SCNA events, where a gene name in black implies no statistically significant SCNA recurrence in either population. b, Effect of copy-number changes on the expression profiles (n = 91 patients) of driver genes with population-specific patterns. Only genes whose SCNA profile is significantly correlated with their corresponding expression profile are plotted (P <0.01 and Spearman’s Rho>0.2). Here, the center line denotes the median, the box edges show the interquartile range and the black line represents the rest of the distribution, except for points that were determined to be ‘outliers’, 1.5 times the interquartile range.
