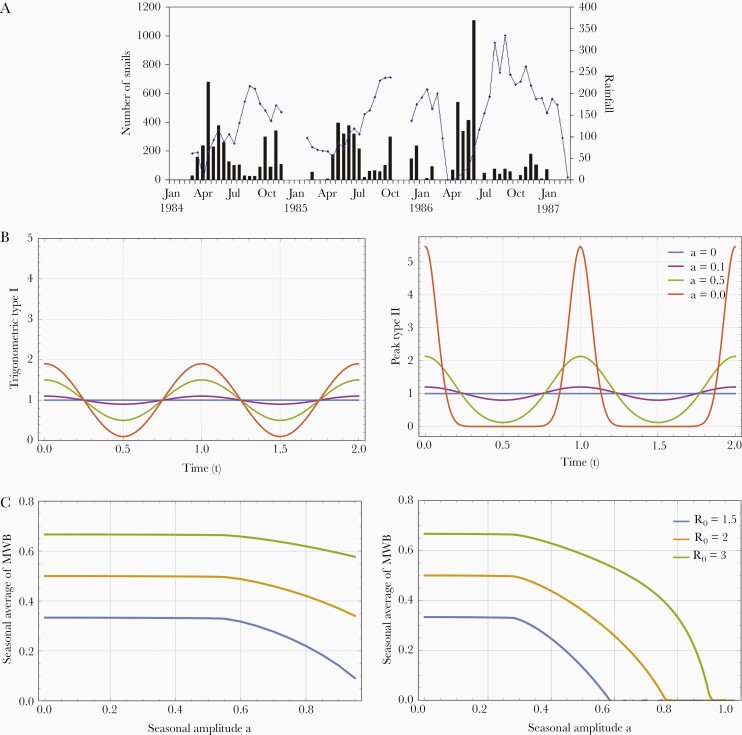
Figure 1.
A, Rainfall data (solid bar) and snail population numbers collected in the Msambweni region of eastern Kenya from March 1984 to January 1987 [3, 22]. B, Examples of type-I (left) and type-II peak (right) seasonality with amplitude parameter . The type-I seasonality was modeled by trigonometric function, , and type-II seasonality was modeled by an elliptic theta function of amplitude , . At small amplitude, , both types are approximately equal, because higher-order Fourier modes become negligible. But as amplitude increases, they depart significantly in their variability (finite for type I and unlimited for type II). C, Seasonal average of mean worm burden (MWB), as a function of amplitude, , for human-snail Macdonald systems Equation (4) for 3 values of basic reproduction number (transmission intensity), . Left, results for a type-I trigonometric model; right, results for a type-II peak model. The curves indicate that for a lower and a higher seasonal amplitude, transmission becomes unsustainable in both type-I and type-II models. Not shown, these curves also depend on snail mortality, which in the case shown was .

