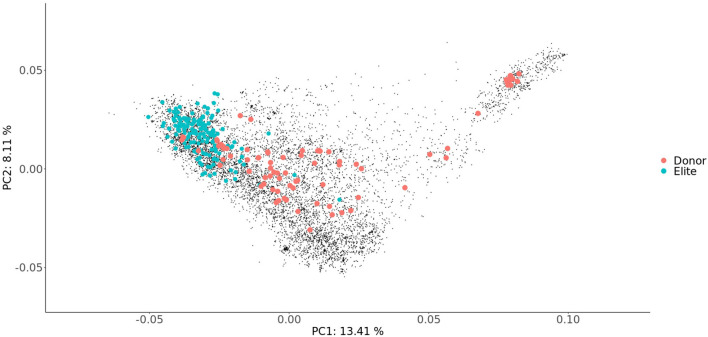
Figure 4.
Principal coordinate analysis of the genotyped genotypes based on the Rogers' distances estimated using genotyping-by-sequencing profiles. PC1 and PC2 refer to the first and second coordinate, respectively. The proportion of explained molecular variance is indicated in parentheses. Blue dots denotes the elite cultivars, red ones the Donor genotypes carrying multiple beneficial alleles, gray ones the wheat genetic resources.

