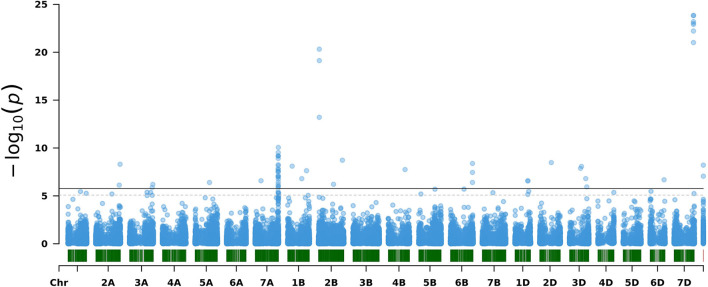
Figure 5.
Manhattan plot of the genome-wide association scans for powdery mildew resistance using Best Linear Unbiased Estimations (BLUEs) of wheat Plant genetic resources (PGR). The solid and dotted lines indicate the significant thresholds corrected for multiple testing using the standard Bonferroni correction (Bonferroni, 1935) and the number of effective markers (Gao et al., 2008), respectively.

