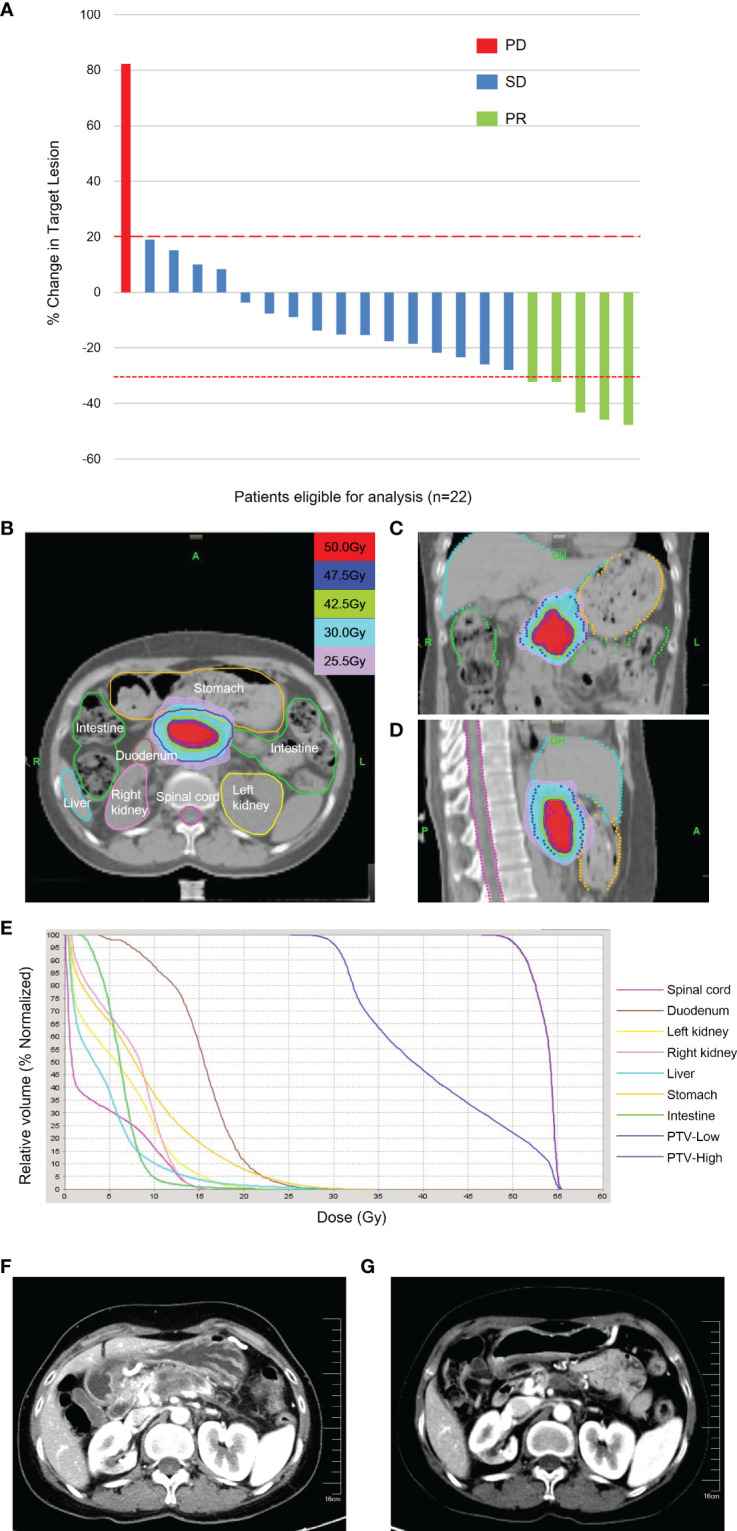
Figure 2.

Best treatment responses and representative radiotherapy plan. (A) Best percentage change in tumor size from baseline during treatment. The dashed lines above and below the x-axis represented 20% increase and 30% decrease of target lesions from baseline, respectively. Different color codes represented different tumor response (red, PD; blue, SD; and green, PR). The isodose lines of axial plane (B), coronal plane (C), and sagittal plan (D). Dose-volume histogram (E) was shown. The different doses were represented with different colors. (F) Enhanced CT demonstrated invasion of vessels by tumor before chemoradiotherapy. (G) Enhanced CT revealed the volume of tumors with vessel invasion decreased after chemoradiotherapy. PD, progressive disease; SD, stable disease; PR, partial response; LAPC, locally advanced pancreatic cancer; CT, computed tomography.
