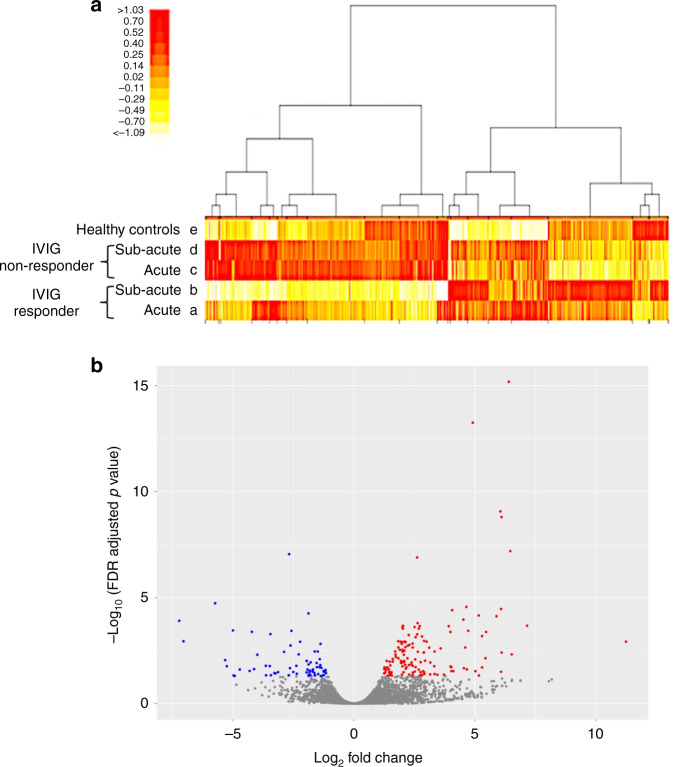
Fig. 1. Comprehensive gene expression analysis of monocytes by cap analysis gene expression sequencing (CAGE-seq).
a Heatmap of the expression levels of all transcription start points by CAGE-seq. Hierarchical clustering demonstrates the average change in the total transcript levels obtained from monocytes of patients with KD during the acute (a) and subacute phases (b) in the IVIG response group (IVIG responder) (n = 3), patients with KD during the acute (c) and subacute phases (d) in the IVIG refractory group (IVIG non-responder) (n = 3), and healthy controls (n = 3) (e). Regions indicated in red are genes with high expression levels, and those indicated in yellow are genes with low expression levels. The columns of the heatmap indicate transcripts and rows that present the participants. b Volcano plot comparing the gene expression of patients with KD pre-IVIG (responders and non-responders, n = 6) with that of healthy controls (n = 3). All the transcripts detected were depicted as dots, and DEGs were colored; genes with higher expression than healthy controls are indicated in red, and those with lower expression levels are indicated in blue.

