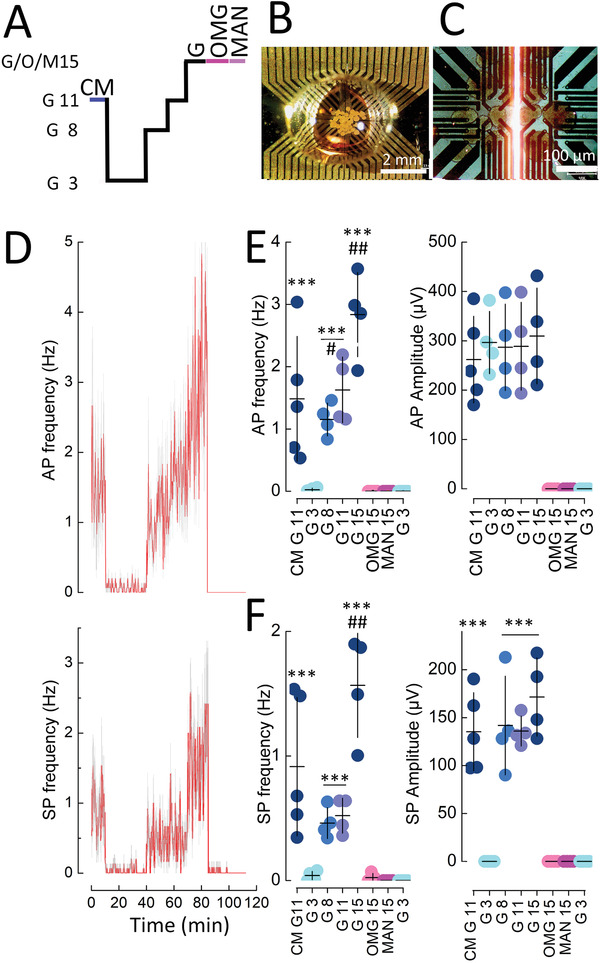
Figure 7.

Recording of islet micro‐organs on vOECTs at different glucose concentrations and in the presence of non‐metabolizable sugars. A) Stimulation protocol with 3, 8, 11, or 15 mm glucose (G), in the presence of culture medium (CM; containing 11 mm glucose and amino acids) or in the presence of non‐metabolizable 15 mm 3‐ortho‐methylglucose (OMG) or 15 mm mannitol (MAN). B) View of islets seeded on vOECTs in a PDMS microfluidic well. C) Enlarged view of islets on vOECTs just prior to recording. D) Time course of action potential (AP) and slow potential (SP) frequencies during the stimulation protocol given in (A). Means in red, SEM in grey. E) Mean action potential frequencies and amplitudes during the indicated conditions. F) Mean slow potential frequencies and amplitudes during the indicated conditions. In (E) and (F) means (horizontal bar) and SEM (vertical bars) are indicated. Tukey post‐hoc test; ***2p < 0.001 versus G3, ## 2p < 0.01 versus G11 or G8. #, 2p < 0.05 versus G8. Glucose concentrations (G3–G15) and electrical activity were highly correlated (frequencies AP, r 2 = 0.9852, p = 0.004; frequencies SP, r 2 0.8528, p = 0.03). Insulin secretion raised from 0.91 ± 0.19 ng/mL/15 min at G3 to 11.04 ± 0.18 ng/mL/15 min at G8 (2p < 0.001).
