Figure 1.

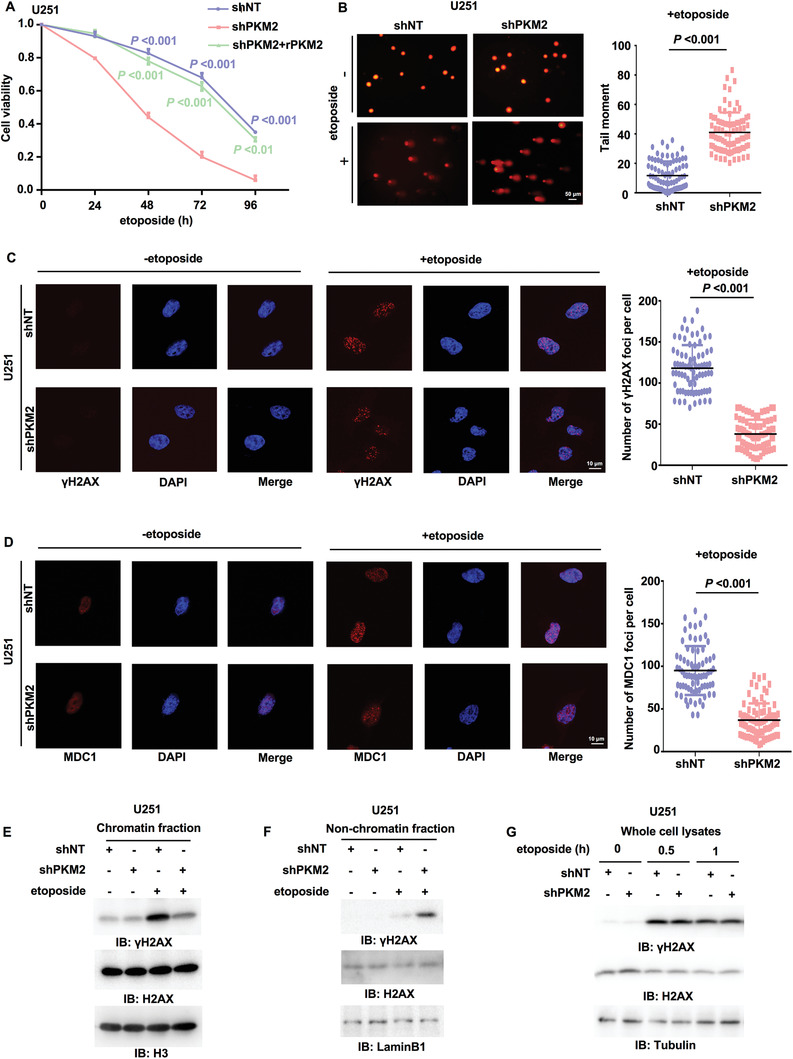
PKM2 is required for γH2AX levels in chromatin, DNA repair, and tumor cell survival. Immunoblotting (IB) experiments were performed with the indicated antibodies. Data are representative of at least three independent experiments. A) U251 cells stably expressing a nontargeting shRNA or PKM2 shRNA were rescued with or without rPKM2. Cells were treated with etoposide (200 × 10–6 m) for indicated time. Cell viability was determined using Trypan blue staining. Data represent the mean ± SD of the viability of the cells from three independent experiments (two‐tailed Student's t‐test). P values for comparisons between shNT and shPKM2 are shown in blue; comparisons between shPKM2 and shPKM2+rPKM2 are shown in green. B) U251 cells stably expressing shNT or shPKM2 were treated with or without etoposide (500 × 10–6 m) for 3 h. The representative images of the comet assay in these cells were shown (left panel). Scatter dot plot (right panel) of the tail moments in the comet assay from shNT‐expressing cells (n = 86) or shPKM2‐expressing cells (n = 86) treated with etoposide. Data represent mean ± SD of the tail moments (Mann Whitney test). Data are representative of three independent experiments. C,D) U251 cells stably expressing shNT or shPKM2 were treated with or without etoposide (40 × 10–6 m, 0.5 h). C) IF staining was performed using anti‐γH2AX antibody. Representative images were shown (left panel). Scatter dot plot (right panel) represents the number of γH2AX foci per cell. Data represent the mean ± SD of the number of γH2AX foci from shNT‐expressing cells (n = 80) and shPKM2‐expressing cells (n = 81) treated with etoposide (Mann Whitney test). Data are representative of three independent experiments. D) IF staining was performed using anti‐MDC1 antibody. Representative images were shown (left panel). Scatter dot plot (right panel) represents the number of MDC1 foci per cell. Data represent mean ± SD of the MDC1 foci number of shNT‐expressing cells (n = 75) or shPKM2‐expressing cells (n = 81) treated with etoposide (Mann Whitney test). Data are representative of three independent experiments. E,F) U251 cells with or without PKM2 depletion were treated with or without etoposide (200 × 10–6 m, 1 h). E) The chromatin fraction and F) nonchromatin‐bound fraction were prepared. G) U251 cells stably expressing shNT or shPKM2 were treated with or without etoposide (200 × 10–6 m) for indicated time. Whole‐cell lysates were prepared after sonication.
