
Figure 4.
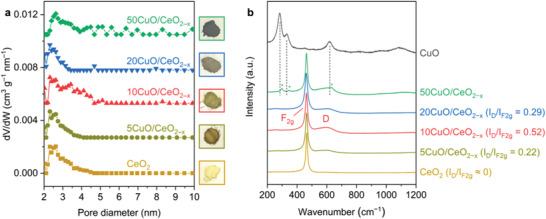
a) Pore‐size distribution and pictures of the CeO2 and CuO/CeO2− x powder samples. b) Raman spectra of the CeO2, CuO, and CuO/CeO2− x samples. The Raman spectra were acquired using a 532 nm excitation laser. Vibration modes corresponding to the segregated CuO x phase for 50CuO/CeO2− x were highlighted using asterisks.