Figure 3.

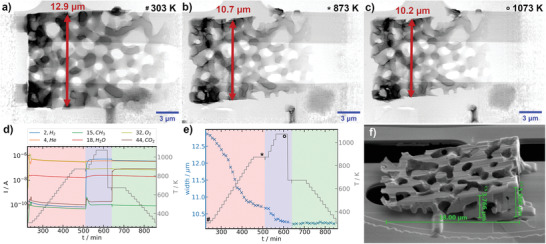
In situ XRP experiments for Ni/Al2O3. a–c) Ptychographic reconstructions with 18.6 nm pixel size, MEMS chip and windows (bright) visible in the background; a) initial state of the dried gel (“#,” 100% He); b) after calcination at 873 K (“⋆,” 20% O2 / He); c) after activation at 1073 K (“○,” 25% H2/He), total gas flow 2 mL min−1; d) selected MS traces and temperature (red box—calcination, blue—activation and green—reaction conditions (20% H2/5% CO2/He)); e) sample width measured at the characteristic feature as indicated by the red arrow in (a‐c) with identical conditions as in (d); f) SEM image before the experiment, the width is based on a single point measurements at each temperature at the identified characteristic feature.
