Figure 4.

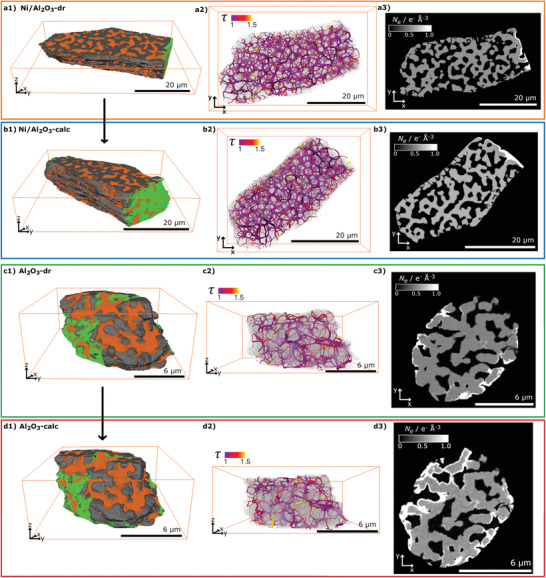
PXCT volume renderings with labeling for a1) Ni/Al2O3‐dr, b1) Ni/Al2O3‐calc, c1) Al2O3‐dr, and d1) Al2O3‐calc, showing “material” (gray), “pores” (orange), and “contamination” (green) labels, with reconstructed voxel sizes a,d) 19.9 nm and b,c) 27.9 nm. a2–d2) Pore network models derived from PXCT data, colormap representing segment tortuosity (τ), with segment size proportional to pore radius (r pore). a3–d3) Selected slices of PXCT volumes with grayscale N e in e− Å−3. The calcined samples b3,d3) were measured after heating the dried gels a3,c3) in air at 823 K (10 K min−1) for 15 min.
