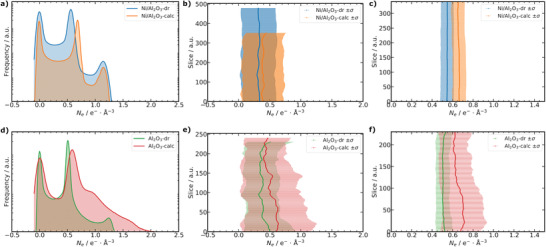
Figure 7.

Electron density (N e) analysis of PXCT data. a,d) N e distribution for the whole particle volumes of Ni/Al2O3 and Al2O3, respectively. b,e) Slice dependent analysis of the mean N e with standard deviation (σ) as errorbars for the whole particle volume of Ni/Al2O3 and Al2O3, respectively. c,f) Selected slice range analysis of the mean N e with σ as errorbars only for the segmented “material” label of the nanoporous solid for Ni/Al2O3 and Al2O3, respectively.
