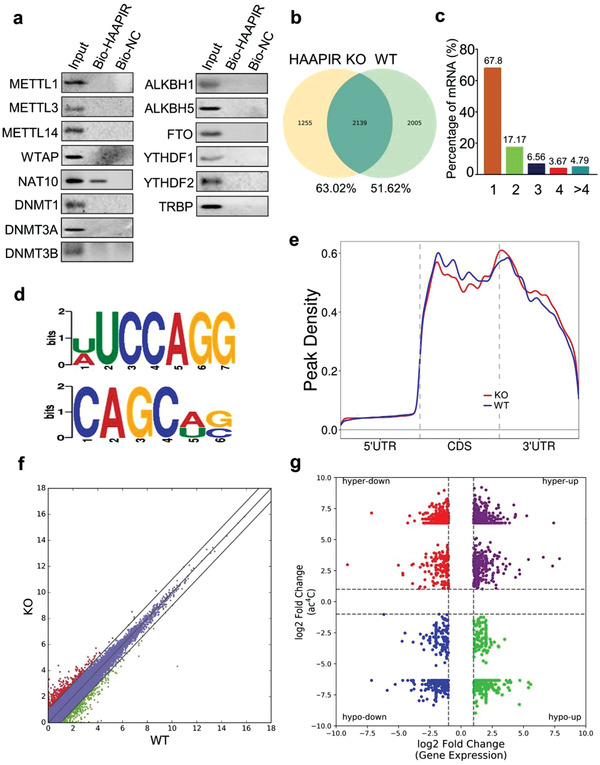
Figure 4.

HAAPIR binds to NAT10 and influences its N4‐acetylcytidine acetylation function. a) Cardiomyocytes were harvested and RNA pull‐down assay was performed using Bio‐ HAAPIR or Bio‐NC. Associated proteins were pulled down with streptavidin beads and bound levels of METTL1, METTL3, METTL14, NAT10, WTAP, DNMT1, DNMT3A, DNMT3B, ALKBH1, ALKBH5, FTO, YTHDF1, YTHDF2, and TRBP were analyzed by western blot. Representative image from three independent experiments. b–g) Ac4C acetylated RNA immunoprecipitation and sequencing (acRIP‐seq) was performed in HAAPIR knockout (KO) and wild‐type (WT) mice hearts. b) Numbers of ac4C peaks detected in HAAPIR KO (left circle) and WT (right circle) mice hearts. c) Percentage of mRNAs with different numbers of ac4C peaks. d) Sequence motifs enriched within ac4C peaks identified by acRIP‐seq. e) Metagene profile showing the distribution of ac4C peaks across the length of transcripts composed of three rescaled nonoverlapping segments 5′UTR, CDS, and 3′UTR in HAAPIR KO and WT mice hearts. f) Scatter plot of differential expression of mRNAs assessed from RNA‐seq data. Red dots denote up‐regulated genes and green dots denote down‐regulated genes. g) Correlation between the level of gene expression (overall transcript) and changes in ac4C level in HAAPIR KO mice hearts compared to WT.
