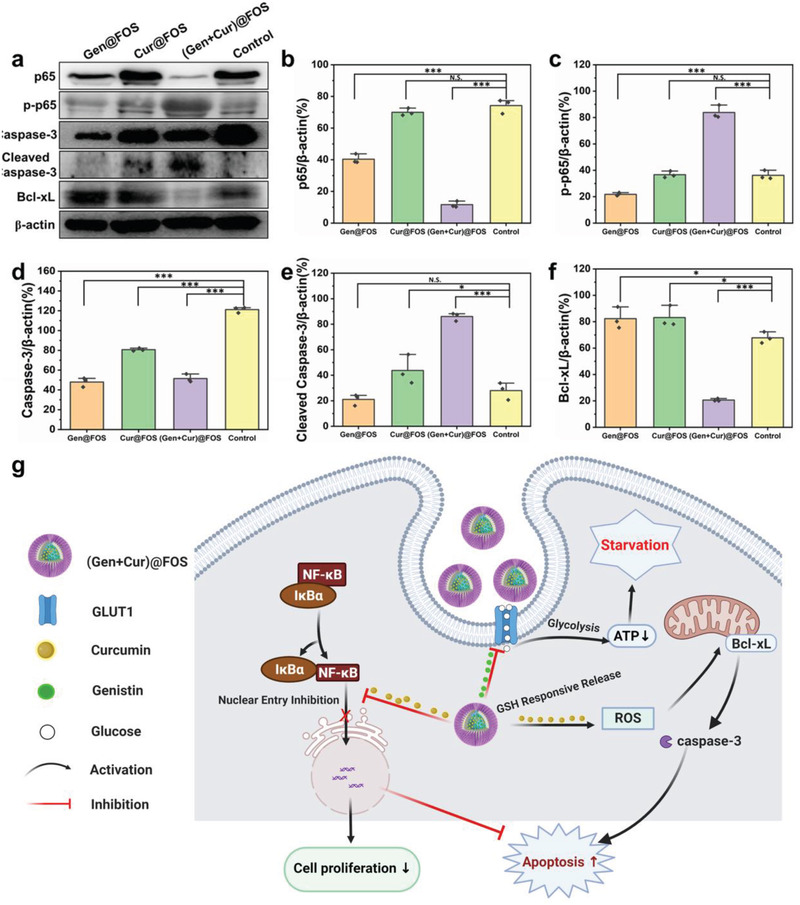
Figure 5.

a) Effects of different treatments on the expression of p65, p‐p65, caspase‐3, cleaved caspase‐3, Bcl‐xL, and β‐actin in HeLa cells treated with (Gen+Cur)@FOS for 48 h. b–f) Quantification for the expression of corresponding proteins from Figure 4a. g) Schematic diagram of the apoptosis mechanism of (Gen + Cur)@FOS. β‐actin expression levels serve as the loading controls. Experiments were repeated three times with similar results. Statistical significances were calculated via Student's t‐test. *P < 0.05, **P < 0.01, and ***P < 0.001.
