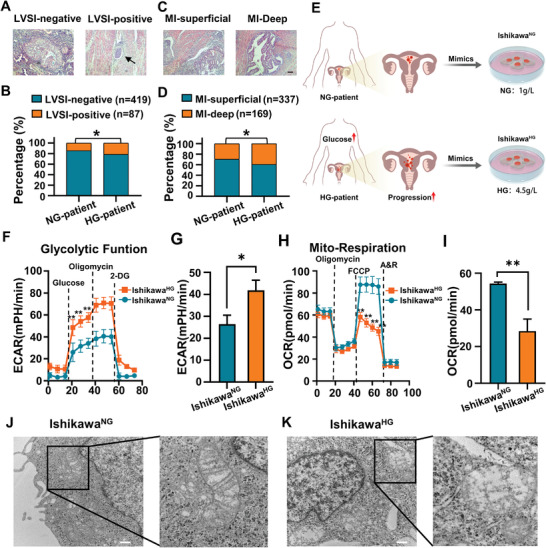
Figure 1.

Hyperglycemia promotes the invasion and progression of EC patients via reprogramming of glucose metabolism. A–D) Correlation analysis between hyperglycemia and the incidence of LVSI and MI in EC patients. NG‐patient: LVSI negative (n = 261), LVSI positive (n = 44); MI‐superficial (n = 215), MI‐deep (n = 90); HG‐patient: LVSI‐negative (n = 158), LVSI‐positive (n = 43); MI‐superficial (n = 122), MI‐deep (n = 79); *P < 0.05. Scale bar: 100 µm. E) The IshikawaNG and IshikawaHG were cultured for at least 8 weeks in glucose concentrations of 1 and 4.5 g L−1 respectively. F,G) Seahorse energy metabolism analysis was used to detect the effect of high glucose on ECAR. The measured ECAR after the addition of glucose, oligomycin, and 2‐deoxyglucose (2‐DG) represented the glycolytic capacity of cells, the maximum glycolytic capacity, and the mechanisms of acid production other than glycolysis, respectively. H,I) Seahorse energy metabolism analysis was used to detect the effect of high glucose on the OCR of EC cells. The OCR value before adding oligomycin represented the basic oxygen consumption, and FCCP represented the maximum oxygen consumption capacity of mitochondria after uncoupling. J,K) The effect of high glucose on the shape of mitochondria in IshikawaHG was observed by TEM. The black box marked the location of mitochondria.Scale bar: 500 nm. Data are shown as mean ± standard deviation (SD). B,D) χ 2 test. F,H) Unpaired Student's t‐test. *P<0.05, **P<0.01.
