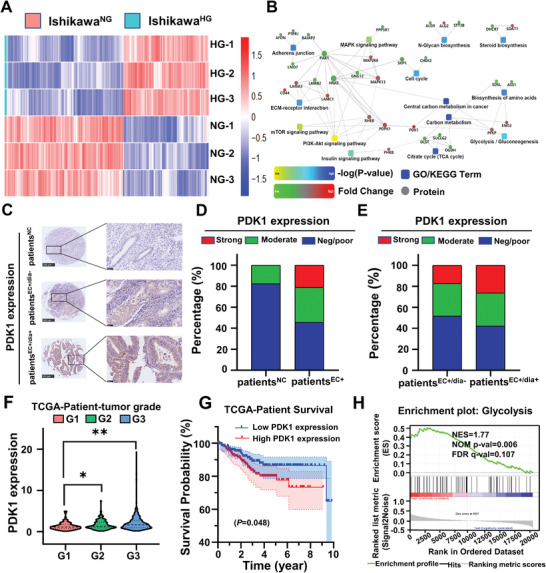
Figure 2.

Screening and validation of the differentially expressed proteins between IshikawaHG and IshikawaNG. A) Hierarchical clustering heat map of differentially expressed proteins in IshikawaHG versus IshikawaNG via label‐free mass spectrometry proteomics. Each column in the map represents a protein, and each row represents a group of samples. Red represents the upregulated proteins, blue represents the downregulated proteins, and white represents no quantitative information on that protein. B) Analysis of the protein–protein interaction of the differentially expressed proteins in IshikawaHG and IshikawaNG. The square in the figure represents the GO/KEGG signaling pathway; the circle represents protein; the line represents the interaction between proteins and pathways; the red circle represents the upregulated proteins; and the green circle represents the downregulated proteins. C) The expression of PDK1 in EC and normal adjacent normal tissues was detected by immuno‐histochemistry. Yellow and brown were positive stains for PDK1. Adjacent normal control endometrial tissue samples (patientNC, n = 17), EC tissue samples (patientEC+, n = 118), nondiabetic EC (patientsEC+/dia−, n = 116) and diabetic EC (patientsEC+/dia+, n = 19). Scale bar: 500 µm. The scale bar of the enlarged drawing is 50 µm. D,E) are the statistical results of panels (C). F) The relationship between PDK1 expression in EC tissues and tumor grades in the TCGA database (n = 543). One‐way analysis of variance (ANOVA). G) According to the median value, the degree of PDK1 expression in type I EC in TCGA database were divided into either low levels (n = 198) or high levels (n = 197). Survival curves of EC patients with high (n = 197) and low (n = 198) PDK1 expression, P = 0.048. Kaplan–Meier. H) GSEA analysis of the signaling pathway in which PDK1 was expressed in significantly high levels. Data are shown as mean ± SD. *P < 0.05, **P < 0.01.
