
Figure 2.
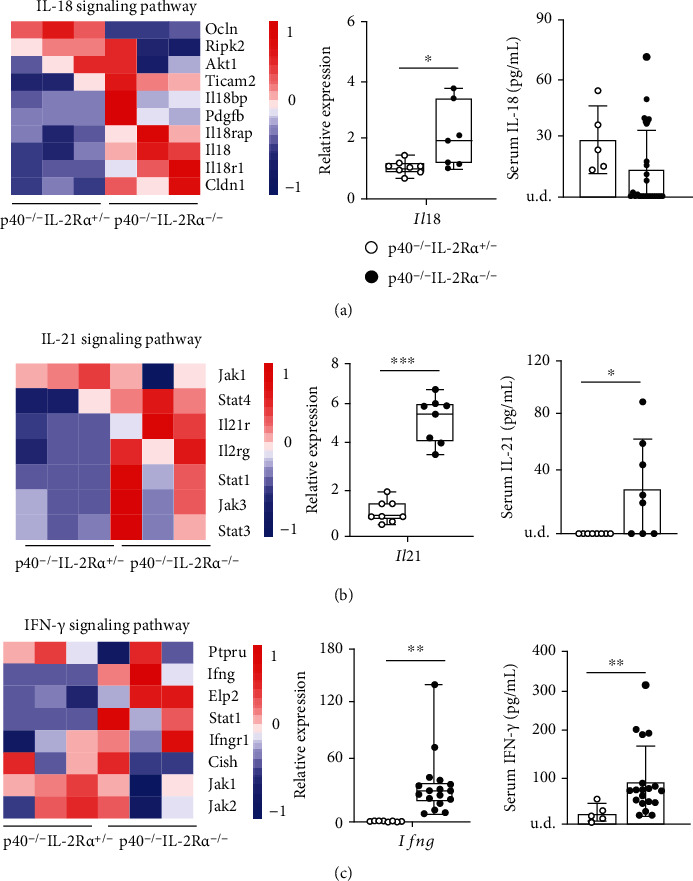
Expression of IL-18, IL-21, and IFN-γ was upregulated in p40−/−IL-2Ra−/− mice. (a) Heat map showing genes contained in the IL-18 pathway; quantitative real-time PCR analysis for IL-18 mRNA levels in p40−/−IL-2Ra−/− (n = 7) and p40−/−IL-2Ra+/- (n = 8) mice and serum IL-18 levels in p40−/−IL-2Ra−/− (n = 25) and p40−/−IL-2Ra+/- (n = 5) mice. (b) Heat map showing genes involved in the IL-21 signaling pathway; quantitative real-time PCR analysis for IL-21 mRNA levels in p40−/−IL-2Ra−/− (n = 8) and p40−/−IL-2Ra+/- (n = 8) mice and serum IL-21 levels in p40−/−IL-2Ra−/− (n = 8) and p40−/−IL-2Ra+/- (n = 8) mice. (c) Heat map showing genes involved in the IFN-γ signaling pathway; quantitative real-time PCR analysis for IFN-γ mRNA levels in p40−/−IL-2Ra−/− (n = 17) and p40−/−IL-2Ra+/- (n = 8) mice and serum IFN-γ levels in p40−/−IL-2Ra−/− (n = 19) and p40−/−IL-2Ra+/- (n = 5) mice. ∗p < 0.05, ∗∗p < 0.01, and∗∗∗p < 0.001. Abbreviations: u.d.: undetected.