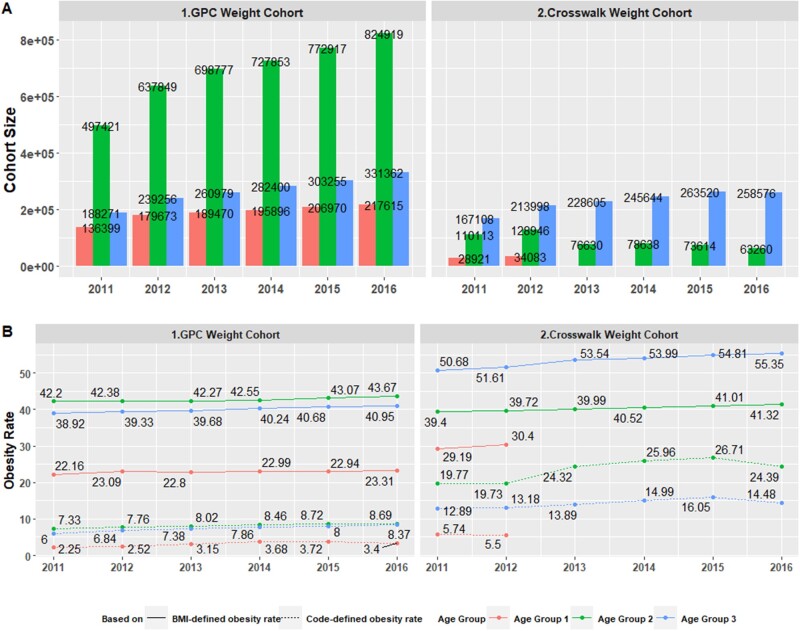
Figure 5.
Electronic health record and claims based obesity rates for different age groups. (A1) and (A2) plot Greater Plains Collaborative Weight Cohort and Crosswalk Weight Cohort sizes stratified by 3 age groups (2–19, 20–64, 65, and older) by calendar year. (B1) and (B2) plot obesity rates where the solid lines correspond to body mass index-defined obesity, whereas the dotted line correspond Code-defined obesity.

