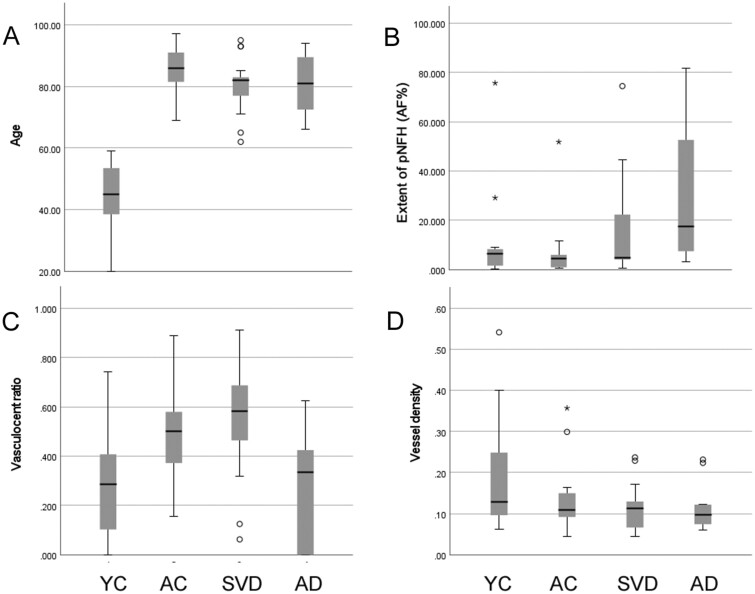
FIGURE 5.
Comparison of age at death, extent of pNfH immunolabeling, pNfH vasculocentric ratio, and vessel density. (A) Age at death (years). (B) Extent of pNfH immunolabeling within subcortical white matter (percent area fraction, AF%). (C) The proportion of small arteries exhibiting a vasculocentric pattern of axonal pNfH labeling (vasculocentric ratio). (D) Density of small arterial vessels within sections of subcortical white matter (vessels/mm2). Data are shown for 4 groups: young adult controls (YC), aged controls (AC), older people with moderate-severe small vessel disease (SVD), and older people with severe AD pathology (AD). Box-whisker plots show the group median, interquartile range (IQR), and full range. Open circles show outliers >1.5 IQR from the end of a box. Asterisks show outliers >3 IQR from the end of a box.

