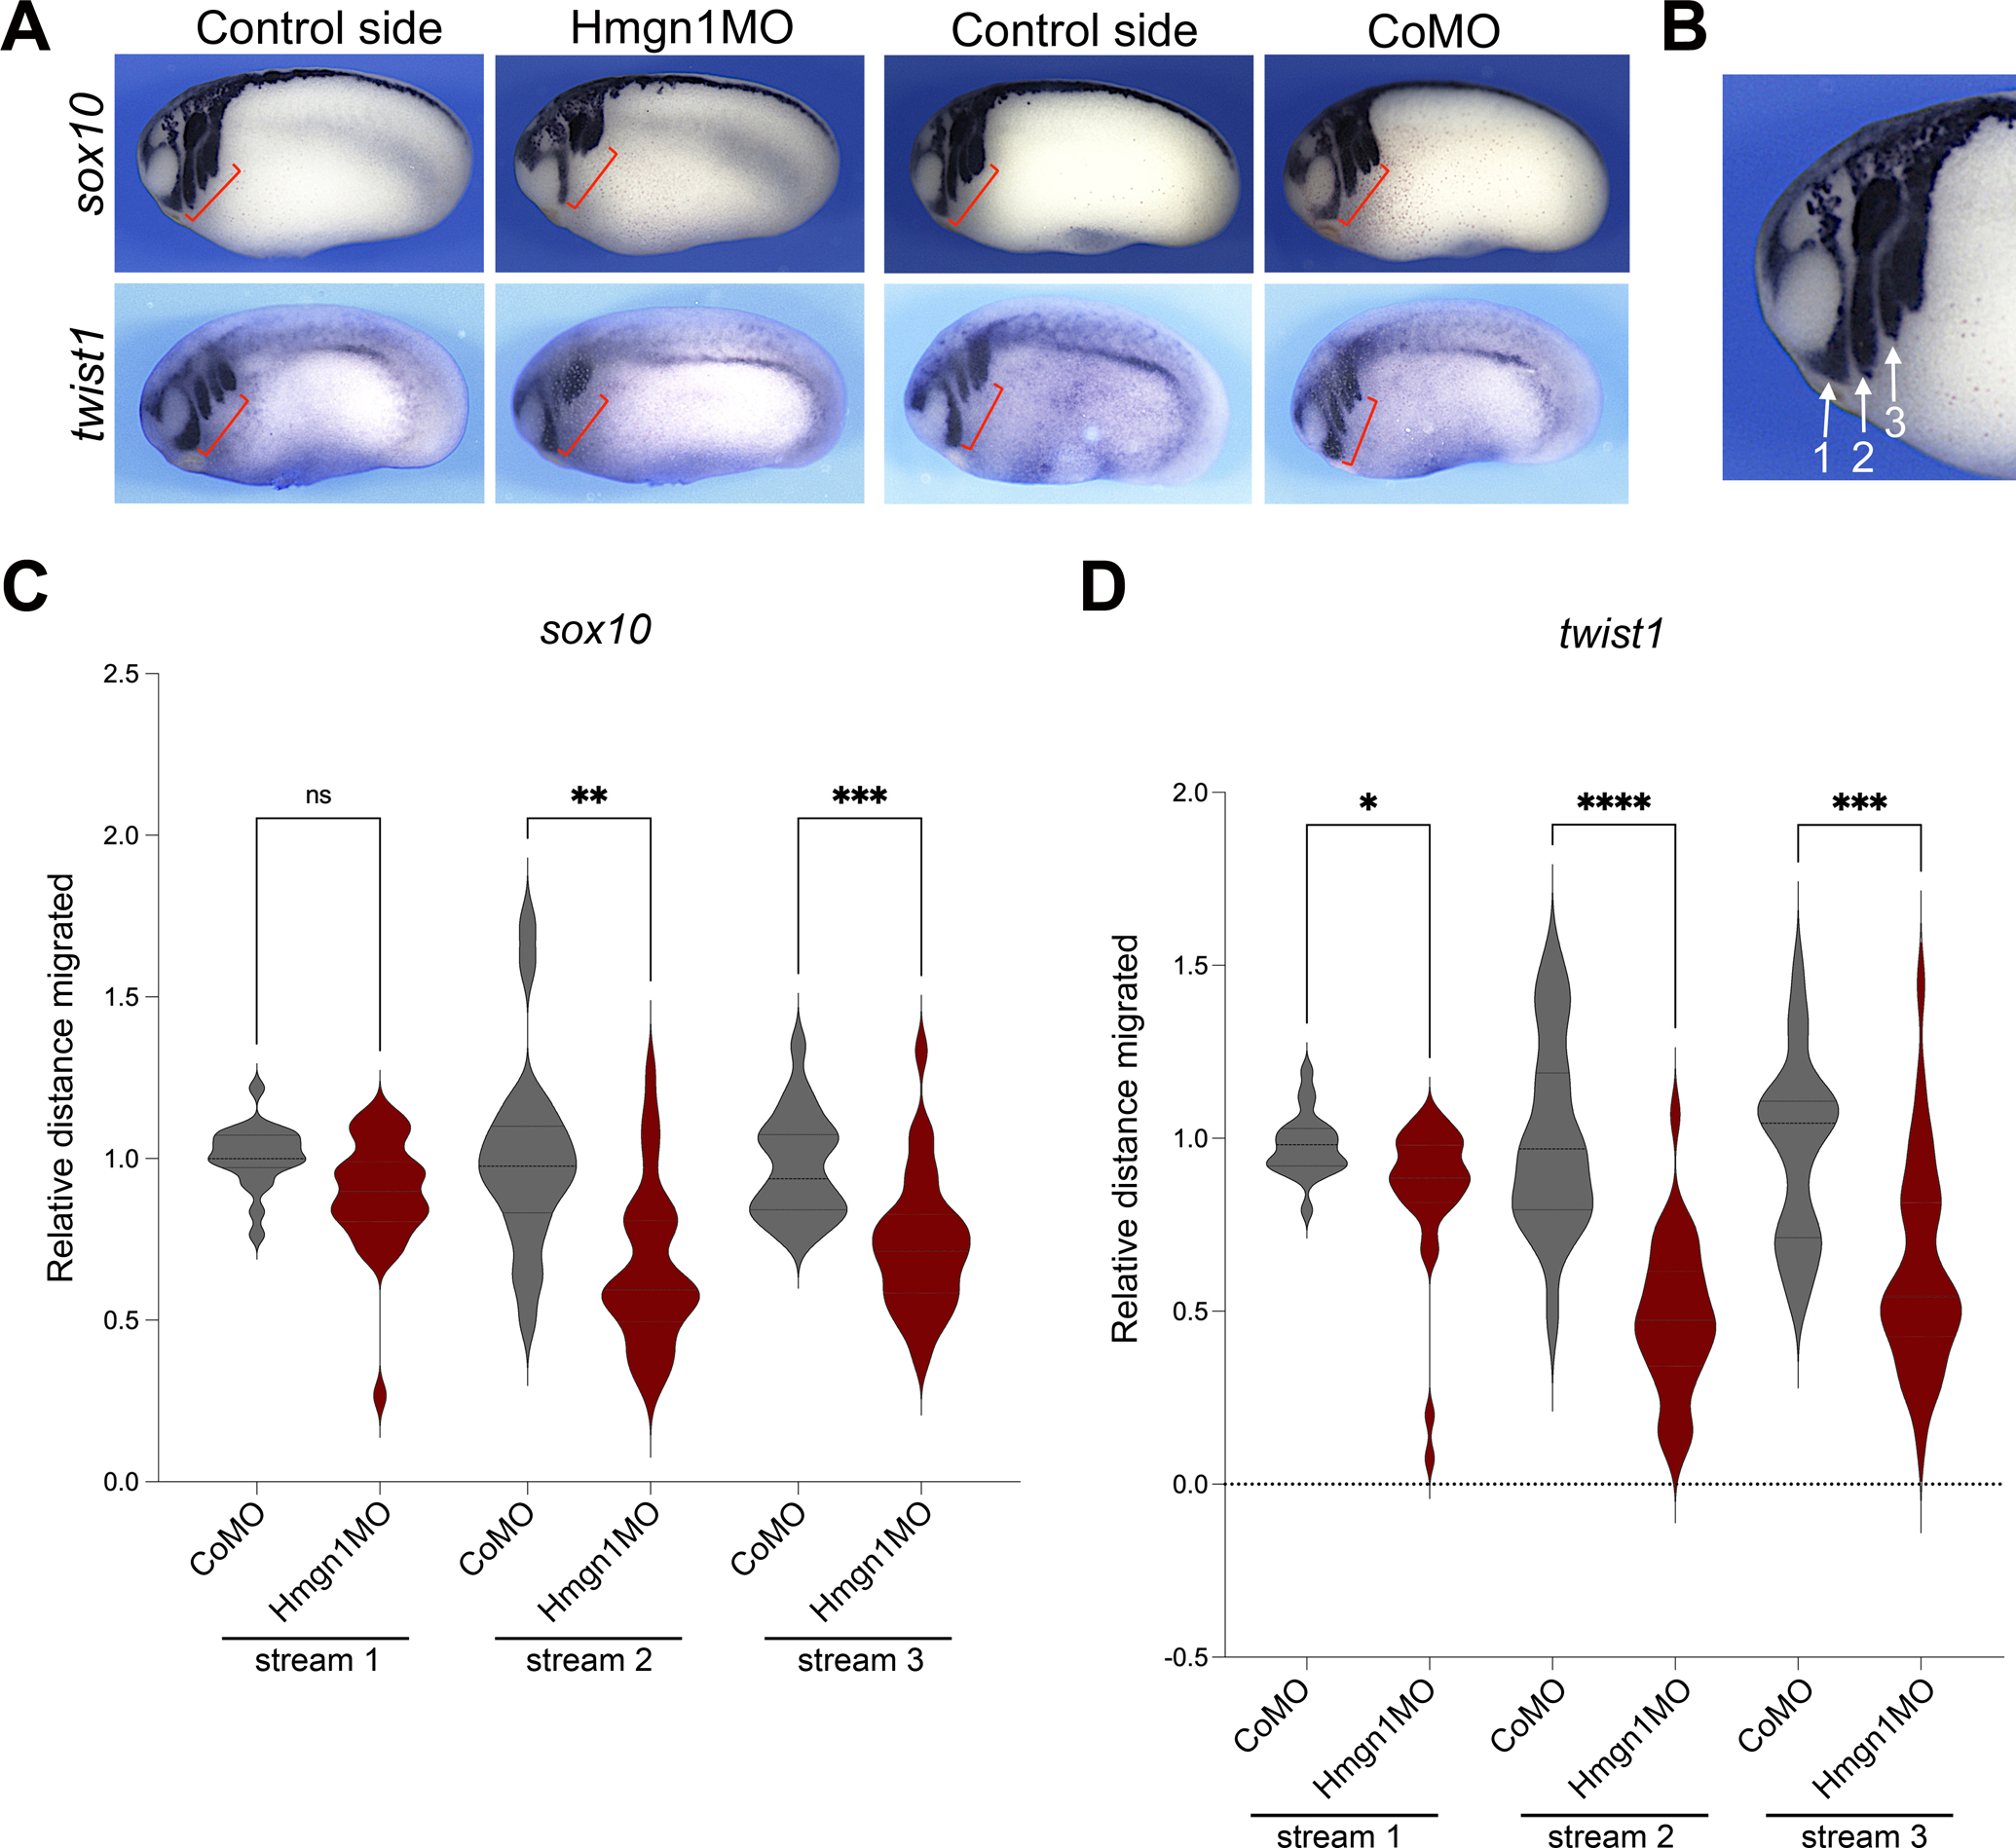
Figure 6: Hmgn1 knockdown affects neural crest streams formation.

(A) Phenotype of CoMO (20 ng) and Hmgn1MO (20 ng) injected embryos at NF stage 23–25 analyzed for sox10 and twist1 expression. The red brackets indicate the extent of dorso-ventral extension of neural crest streams in control and MO-injected sides. (B) Higher magnification of an embryo stained with sox10 showing the position of the three neural crest streams. Lateral view, dorsal to top, anterior to left. (C-D) Graph plotting the distance migrated by neural crest cells in stream 1, 2 and 3 of CoMO- and Hmgn1MO-injected embryos stained by sox10 (C) or twist1 (D). A similar number of embryos were analyzed for each gene (CoMO, n=21 and Hmgn1MO, n=30). Brown-Forsyth and welch ANOVA test, with multiple comparisons test (Dunnett) with individual variances computed for each comparison. *, p=0.0141; **, p=0.0013; ***, p=0.0003; ****, p<0.0001; ns: not significant.
