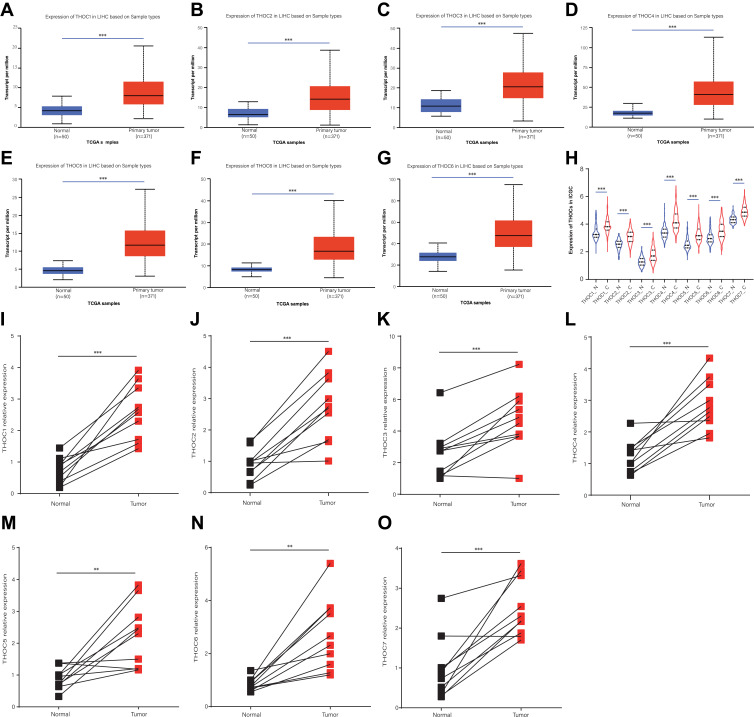
Figure 1.
Expression of THO complex members in transcriptional levels in patients with HCC. (A–G) The mRNA expression of THO complex members in HCC tissues (UALCAN). Compared with normal liver tissues, the expression of THOC1/2/3/4/5/6/7 was increased in HCC tissues. (H) The level of THOCs in normal and HCC tissues (ICGC). (I–O) The relative expression levels of THOCs in 10 paired normal and HCC tissues (qRT-PCR). **P < 0.01, ***P < 0.001.

