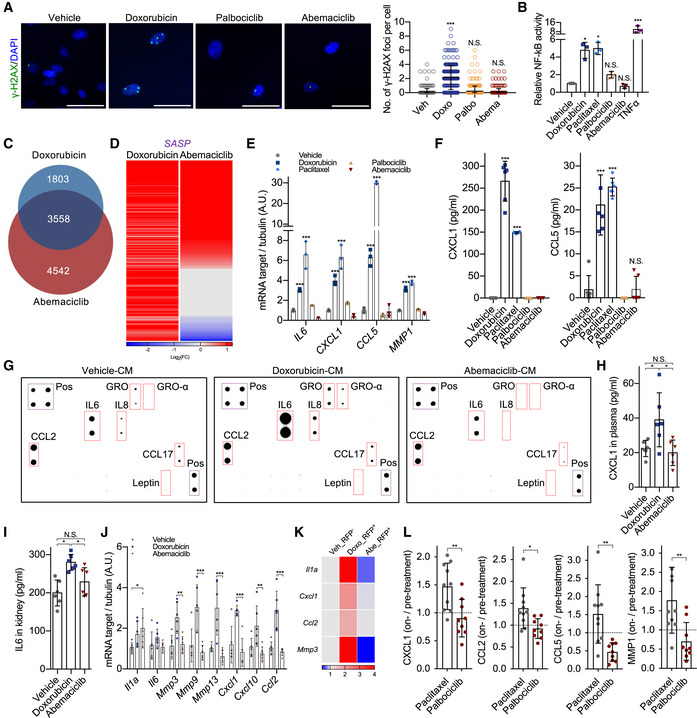
Figure 3. CDK4/6i‐induced senescence lacks NF‐κB activity and NF‐κB‐driven SASP components.

-
A8 dpt, cells were stained for γ‐H2AX (scale bar, 60 μm) and quantified (vehicle = 288 cells, doxorubicin = 280 cells, palbociclib = 276 cells, abemaciclib = 266 cells from 3 independent experiments).
-
BBJ cells transduced with a NF‐κB reporter were treated with vehicle, doxorubicin, paclitaxel (50 nM for 24 h), palbociclib (1 μM for 8 times in 24 h), or abemaciclib, and luciferase activity was measured 8 dpt. TNF‐α treatment was used as positive control (n = 3 independent experiments).
-
C, DVenn plot of RNA‐sequencing datasets of treated cells at 8 dpt (n = 3 independent samples, sequenced together) (C). Heatmap of the SASP genes (D) (Table EV2) for doxorubicin‐ or abemaciclib‐treated groups (8 dpt) relative to the vehicle‐treated group from the RNA‐sequencing datasets (P < 0.01 was regarded as significant).
-
E8 dpt, qRT–PCR of indicated NF‐κB‐associated SASP genes was performed using indicated treated BJ cells 8 dpt (n = 3 independent experiments).
-
FSerum‐free conditioned media (CM) were collected from vehicle‐, doxorubicin‐, paclitaxel‐, palbociclib‐, or abemaciclib‐treated BJ cells 8 dpt, and expression levels of CXCL1 and CCL5 were measured by ELISA (n = 6 independent experiments).
-
GProteins in the serum‐free conditioned media (CM) collected from doxorubicin‐ or abemaciclib‐treated BJ fibroblasts (8 dpt) were measured by cytokine array. Purple boxes indicated internal positive controls from each membrane; red boxes highlighted the most typical SASP factors.
-
H–Kp16‐3MR mice were treated with vehicle (PBS, 7 consecutive days), doxorubicin (5 mg/kg, 3 consecutive days), or abemaciclib (50 mg/kg, 7 consecutive days). 15 dpt, plasma was collected and expression levels of CXCL1 were measured by ELISA (H); protein lysate was obtained from drug‐treated kidneys to quantify IL‐6 by ELISA (I); and RNA was isolated from kidneys, and mRNA encoding indicated NF‐κB‐associated genes (J) were quantified by qRT–PCR. n = 6 mice/group. From a subset of the mice, RFP+ cells were sorted from the renal cortex using FACS and mRNA encoding indicated NF‐κB‐associated pro‐inflammatory genes were quantified by qRT–PCR. The values of fold change over vehicle were plotted in the heatmap. n = 4 mice/group (K).
-
LCell‐free plasma was derived from breast cancer patients treated with paclitaxel (n = 10) or palbociclib (n = 9) and the expression levels of CXCL1, CCL2, CCL5, and MMP1 were quantified by ELISA. The values represent the ratio between on‐treatment and pretreatment levels for each patient.
Data information: Data are means ± SD. One‐way ANOVA (A, B, F, H and I). Two‐way ANOVA (E and J). Unpaired Student’s t‐test (L). *P < 0.05, **P < 0.01, and ***P < 0.001, N.S. = not significant. Doxo, doxorubicin. Abe, abemaciclib. dpt, days post‐treatment.
