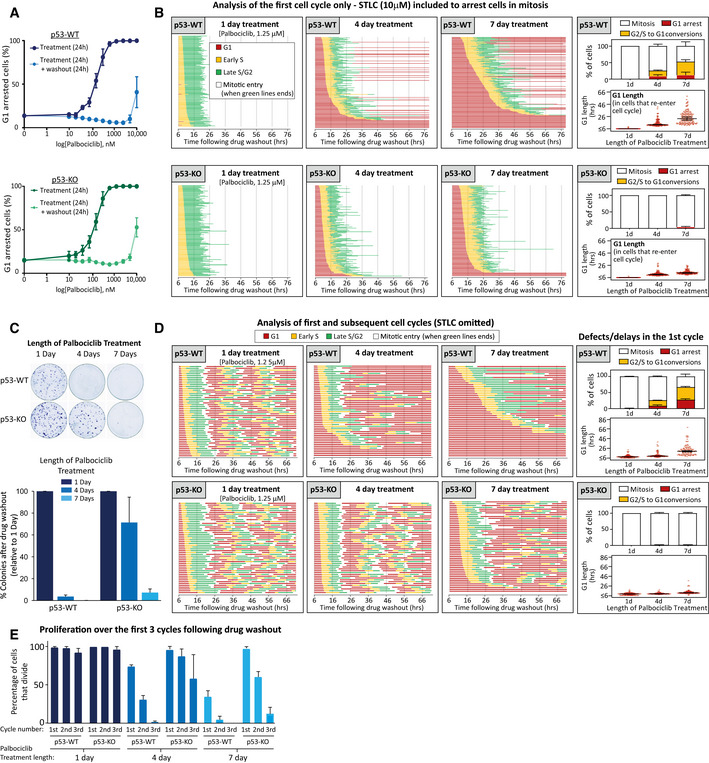
Dose–response curves displaying the percentage of G1‐arrested p53‐WT (blue) or KO (green) RPE1‐FUCCI cells following 24 h incubation with palbociclib (dark solid lines) or 24 h after subsequent washout (light dotted lines). Graphs display mean data ± SEM from three experiments, with at least 500 cells counted per condition per experiment.
Cell cycle profile of individual p53‐WT or KO RPE1‐FUCCI cells (each bar represents one cell) after washout from 1, 4 or 7 days of treatment with palbociclib (1.25 μM). STLC (10 μM) was added to prevent progression past the first mitosis. Fifty cells were analysed at random for each repeat and three experimental repeats are displayed (150 cells total). The right‐side panels show quantifications of cell cycle defects and G1 lengths from the displayed single‐cell profile plots. Note, G1 length is estimated by mKO‐Cdt1 expression, and G1 lengths of less than 6 h could not be quantified since movies were only stated after the 6 h drug washout period. These are indicated on the graphs as < 6 h. Bar graphs show mean + SD. In the violin plots, horizontal lines display the median, and error bars show 95% confidence intervals.
Representative images and quantifications of colony forming assays in p53‐WT or KO RPE1 cells treated with palbociclib (1.25 μM) for 1, 4 or 7 days and then grown at low density without inhibitor for 10 days. Each bar displays mean data + SEM from three experiments.
Cell cycle profile of individual p53‐WT or KO RPE1‐FUCCI cells to analyse multiple rounds of division following washout from 1, 4 or 7 days of treatment with palbociclib (1.25 μM). FUCCI profiles show 50 cells analysed at random from one experiment, which is representative of three experimental repeats. The right‐side panels show quantifications of cell cycle defects and G1 lengths from the three experimental repeats. Note, G1 length is estimated by mKO‐Cdt1 expression, and G1 lengths of less than 6 h could not be quantified since movies were only stated after the 6 h drug washout period. These are indicated on the graphs as < 6 h. Bar graphs show mean + SD. In the violin plots, horizontal lines display the median, and error bars show 95% confidence intervals.
Quantification of cell cycle profiles from cells treated as in (D). Graph shows the mean percentage of cells + SD that divide at each round of division, with 150 cells analysed in total from three experimental repeats.

