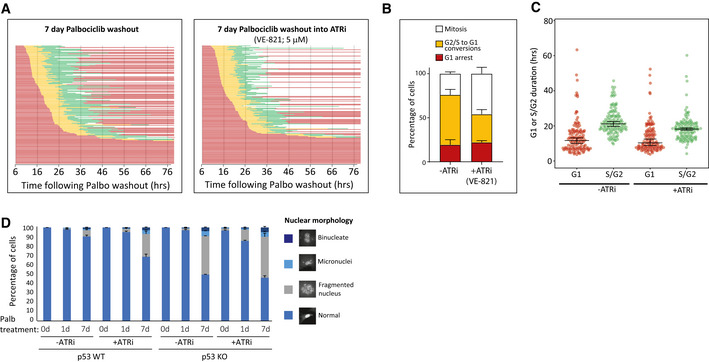
Figure EV2. Effect of ATR inhibition on the response of RPE1 cells to CDK4/6 inhibition.

-
ASingle‐cell cycle profiles quantified immediately following washout from 7 days 1.25 µM Palbociclib treatment. After washout, cells were cultured in the absence or presence of the ATR inhibitor, VE‐821 (5 µM). STLC was also added at drug washout to allow analysis of just the first cell cycle. Each bar represents an individual cell, and graphs show the data from three experimental repeats (150 cells analysed in total).
-
B, CQuantifications of the cell cycle defects (B) and G1 or S/G2 durations (C) from the single‐cell profiles shown in (A). Note, G1 length is estimated by the duration of mKO‐Cdt1 expression, and S/G2 by the time from AG‐Geminin expression until mitotic entry. Only cells that re‐enter the cell cycle were included in this quantification (G1‐arrested cells excluded). Bars graphs in (B) display mean + SD from three experimental repeats, violin plots in (C) display the variation in G1 and S/G2 length between individual cells, with horizontal lines indicating the median, and error bars representing 95% confidence intervals.
-
DQuantification of the nuclear morphologies following palbociclib (1.25 μM) treatment in p53‐WT and KO RPE1 cells. Cells were treated for 0, 1 or 7 days and before washout for 48 h (± ATR inhibition with 5 µM VE‐821). Nuclear morphologies of 100 cells were counted per condition and per experiment, and bar graphs represent mean data + SEM from three experiments.
