-
A
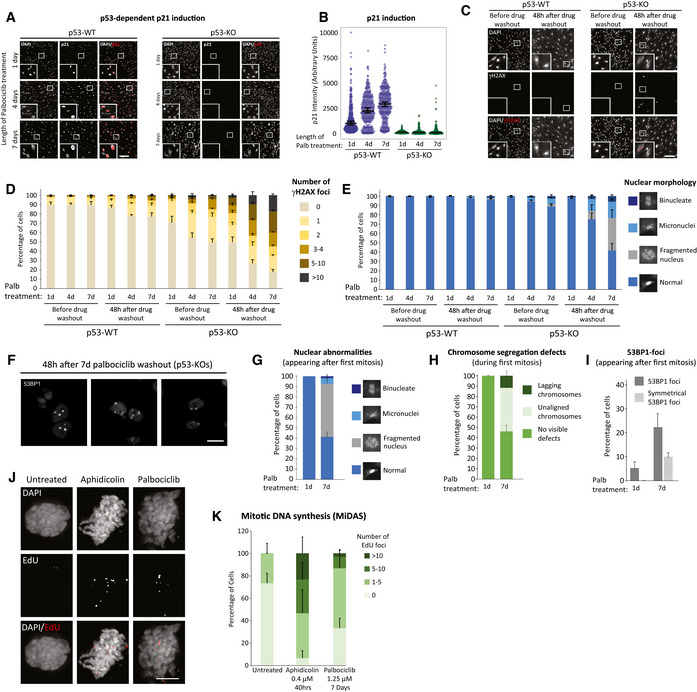
Representative immunofluorescence images of p21 levels in p53‐WT or KO RPE1 cells, 48 h after release from 1, 4 or 7 days palbociclib (1.25 μM) treatment. Zoom inserts are 3× magnification of the indicated regions. Scale bars = 250 μM.
-
B
Quantification of p21 intensities in cells treated as in panel (A). At least 100 cells were analysed per experiment and graph shows data from three experimental repeats. Violin plots display the variation in intensities between individual cells. Horizontal lines display the median, and error bars show 95% confidence intervals.
-
C
Immunofluorescence images of DAPI and γH2AX staining in p53‐WT or KO RPE1 cells either before or 48 h after release from a 7‐day treatment with palbociclib (1.25 μM). Scale bar = 250 μM, zoom inserts = 3× magnification of highlighted regions.
-
D, E
Quantification of nuclear morphologies (D) and γH2AX‐positive DNA damage foci (E) following palbociclib (1.25 μM) treatment in p53‐WT and KO RPE1 cells. Cells were treated for 1, 4 or 7 days and then analysed before or after drug washout for 48 h. A total of 100 cells (nuclear morphology) or 50 cells (γH2AX foci) were scored per condition per experiment, and bar graphs represent mean data + SEM from six experiments.
-
F
Immunofluorescence images showing symmetrical 53BP1 staining following mitotic exit in p53‐KO cells after release from 7 days of palbociclib arrest. Three separate examples are displayed. Scale bar = 25 μM.
-
G–I
Analysis of chromosome segregation errors and DNA damage during the first mitosis in GFP‐53BP1/H2B‐RFP RPE1 cells after release of from a 1‐ or 7‐day palbociclib (1.25 μM) arrest. Quantified from the same movies are nuclear morphology after mitosis (G), chromosome segregation defects during mitosis (H) and appearance of 53BP1 foci after mitosis (I). A total of 54 cells (1 day) or 80 cells (7 days) were analysed in total from two experiments. Errors bars display SD.
-
J, K
Representative immunofluorescence images (J) and quantifications (K) of mitotic DNA replication assays (MiDAS) in p53‐KO RPE1 cells released from 7 days of palbociclib (1.25 μM) treatment or following 0.4uM aphidicolin treatment for 40 h. EdU foci were quantified in nocodazole‐arrested cells. Scale bar = 5 μM, zoom inserts = 3× magnification of highlighted areas. Ten cells were analysed per experiment and the bar chart shows the mean + SEM from three experimental repeats.

