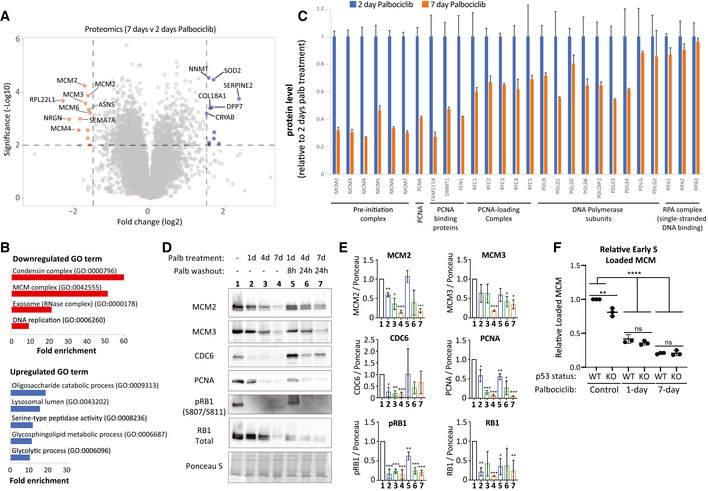
Figure 4. Prolonged G1 arrest following palbociclib treatment in RPE1 cells downregulates replisome components and impairs origin licencing.

- Volcano plot of proteins up or downregulated following prolonged palbociclib (1.25 μM) treatment in RPE1 cells. The top 10 significantly upregulated and downregulated proteins are shown in blue and red respectively.
- The top up‐ or downregulated Gene Ontology (GO) terms following 7‐day palbociclib (1.25 μM) treatment relative to 2 days of treatment.
- Quantification of relative change in protein levels of selected replisome components between 2‐day (blue bars) and 7‐day (orange bars) palbociclib (1.25 μM) treatment. Graphs display mean + SD from 2–3 experimental repeats.
- Representative western blots of whole‐cell lysates from RPE1‐WT cells treated with palbociclib (1.25 μM) for 1, 4 or 7 days, or treated identically, and then washed out for the indicated times to reflect when the majority of cells are in S‐phase (see Fig 1C).
- Analysis of adjusted relative density from three independent western blot experiments. Bars display mean values ± SD. Significance determined by unpaired Student's t‐test comparing treated target protein to asynchronous target control (*< 0.01, ** < 0.001, *** < 0.0001).
- Quantification of loaded MCM in p53‐WT and KO RPE1 cells treated with palbociclib (1.25uM) for 1 or 7 days followed by drug washout for 8 h after 1 day of arrest or 24 h after 7 days of arrest to capture cells in early S‐phase. To quantify loaded MCM, soluble MCM was pre‐extracted from cells and the amount of the remaining DNA‐loaded MCM was analysed by flow cytometry (see Appendix Fig S4 for representative FACS profiles). DNA content was measured with DAPI, and DNA synthesis was measured using a 30‐min EdU pulse. The amount of DNA‐loaded MCM in early S‐phase cells was compared to untreated control cells. The measured fluorescent intensity of each sample was divided by the background intensity of an identically treated but unstained control. The resulting ratios were normalized to WT control cells. Graphs display mean data ± SD from three experimental repeats. Significance determined by one‐way ANOVA followed by Tukey's multiple comparisons test (**P = 0.001, ****P < 0.0001).
