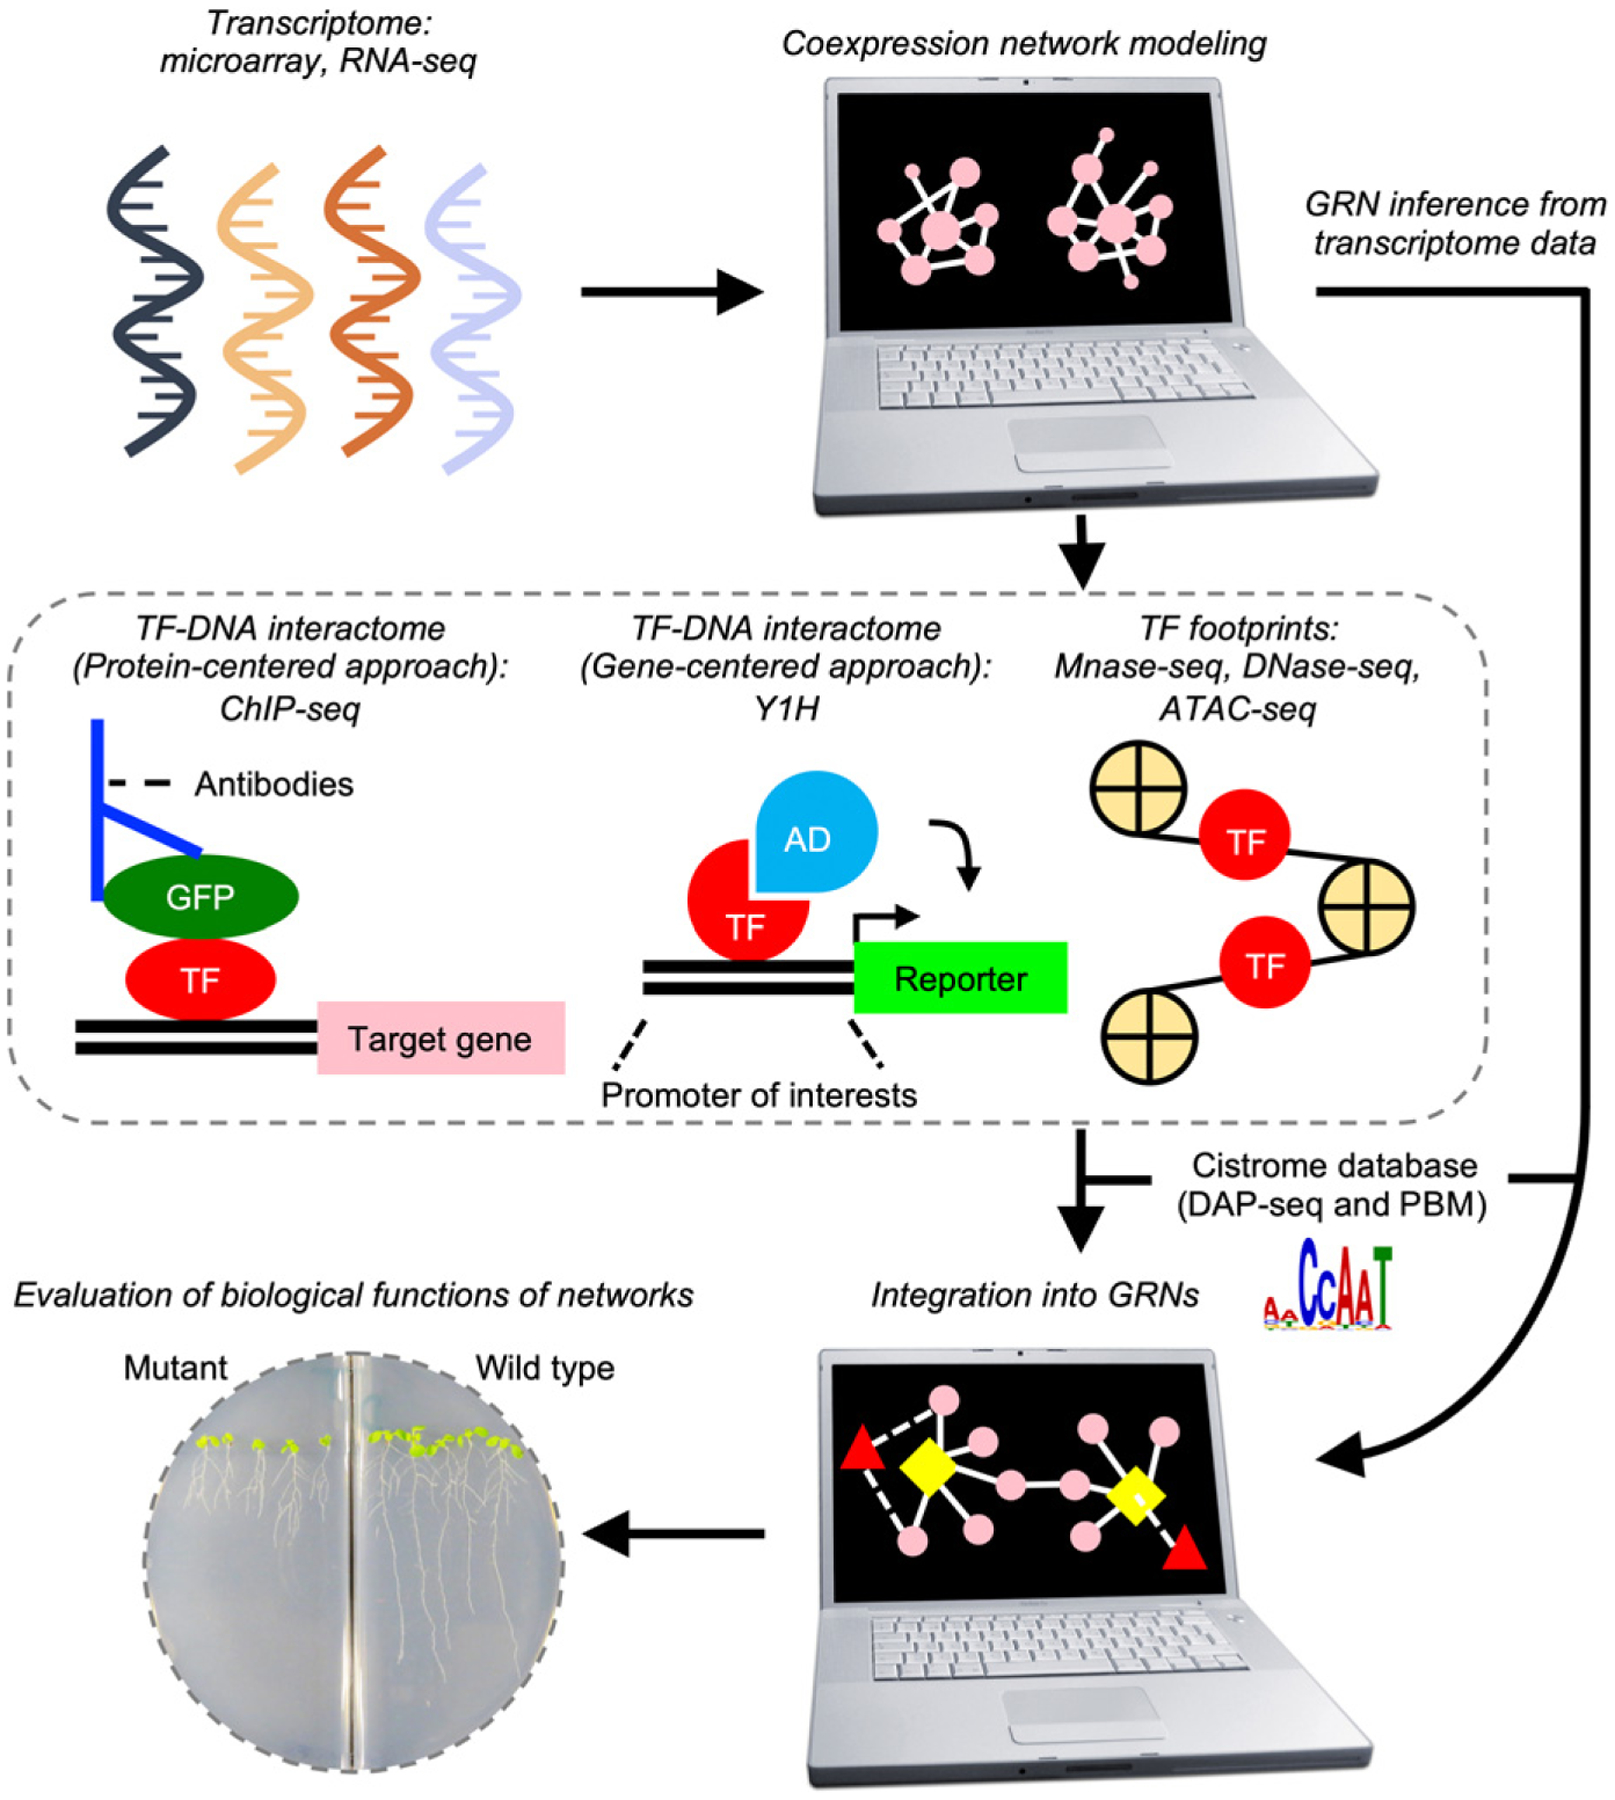
Figure 1.

Schematic view of transcriptional network analysis.
Transcriptional network analysis consists of data acquisition, network modeling and assessment of network functions. Gene expression data obtained by high-throughput technologies can be used to construct coexpression networks, which are subsequently either integrated with transcription factor (TF)-DNA interactome data to build gene-regulatory networks (GRNs) or used to infer GRN bypassing the generation of TF-DNA interactome data. Biological functions of resulting GRNs are evaluated through genetic perturbations of predictive regulatory hub genes. Pink circle: genes affiliated in GRNs. Yellow rhombus: predicted regulatory hub genes, Red triangles: TFs. Edges indicated by solid and dot lines, respectively: coexpression interactions. AD, activation domain; ATAC-seq, Assay for Transposase-Accessible Chromatin with high-throughput sequencing; ChIP-seq, chromatin immunoprecipitation sequencing; DAP-seq, DNA affinity purification sequencing; GFP, green fluorescence protein; PBM, protein-binding microarray; Y1H, yeast one-hybrid.
