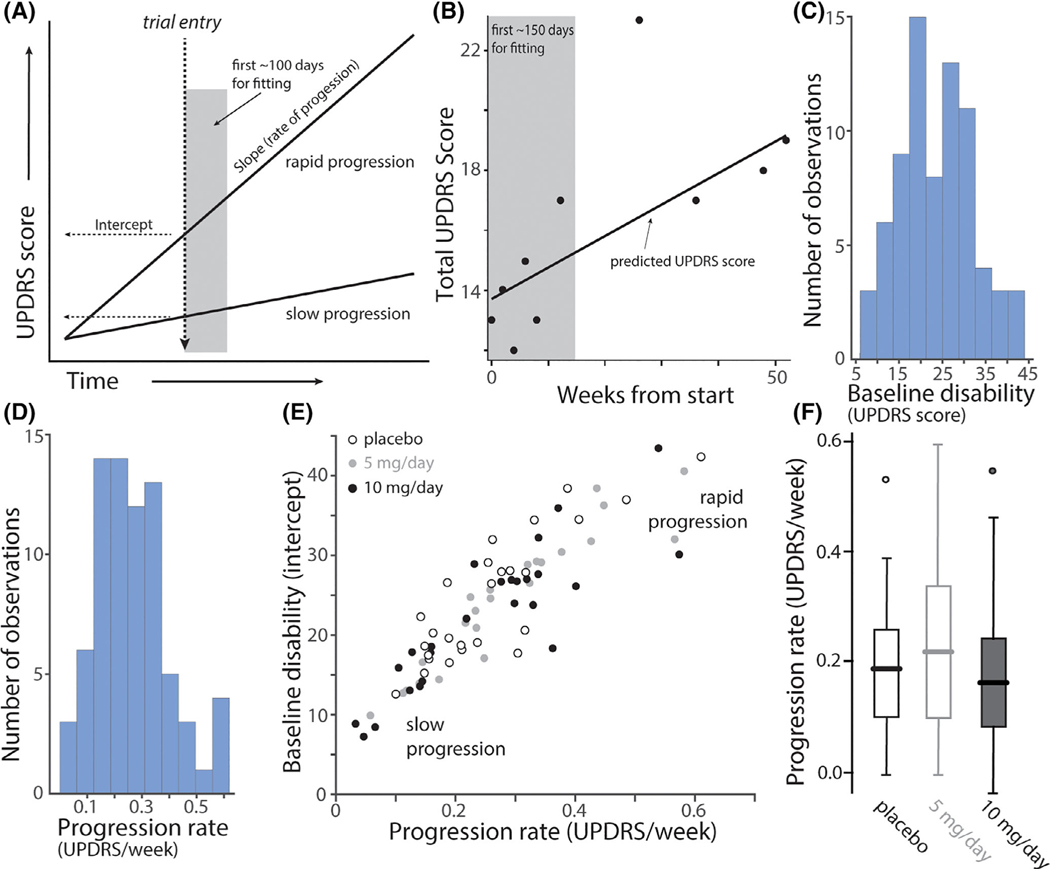
FIG. 1.
Progression rates and baseline disabilities as measured by UPDRS rating in treatment cohorts. (A) Hypothetical linear regression plots of UPDRS disability scores as a function of time after PD diagnosis for a rapidly and a slowly progressing patient. Trial entry was assumed to be at the same time after diagnosis for both patients (dashed vertical line). The estimate of UPDRS score at enrollment (baseline disability) is shown as the intercept with trial entry line; the slope of the progression line was estimated from repeated measures during the first 150 days of the trial (grey box), during which time it was assumed that patients were not receiving symptomatic therapy and, during which the treatment intervention may not had a significant effect. (B) An example of data from a patient during the fitting interval and afterward with a linear regression fit. (C) Histograms of the slope (progression rate measured as change in total UPDRS score per week; left panel) and the intercept (baseline UPDRS score; right panel) of the linear regression analysis. (n = 75). Note the wide range of slopes and baseline UPDRS scores. (D) Scatter plot of the progression rate (slope) and baseline disability (intercept) for placebo (n = 26; open circles), low dose isradipine (5 mg/day, grey circles, n = 23) and high dose isradipine (10 mg/day, black circles n = 26). Note that all three groups included a similar distribution of patients that were rapidly and slowly progressing at trial enrollment. (F) Boxplots of the slopes for placebo (n = 26), 5 mg/day (n = 23) and 10 mg/day (n = 26) treatment groups. Outliers are shown as circles. There was no difference between groups in the initial slopes (P = 0.42, ANOVA).

