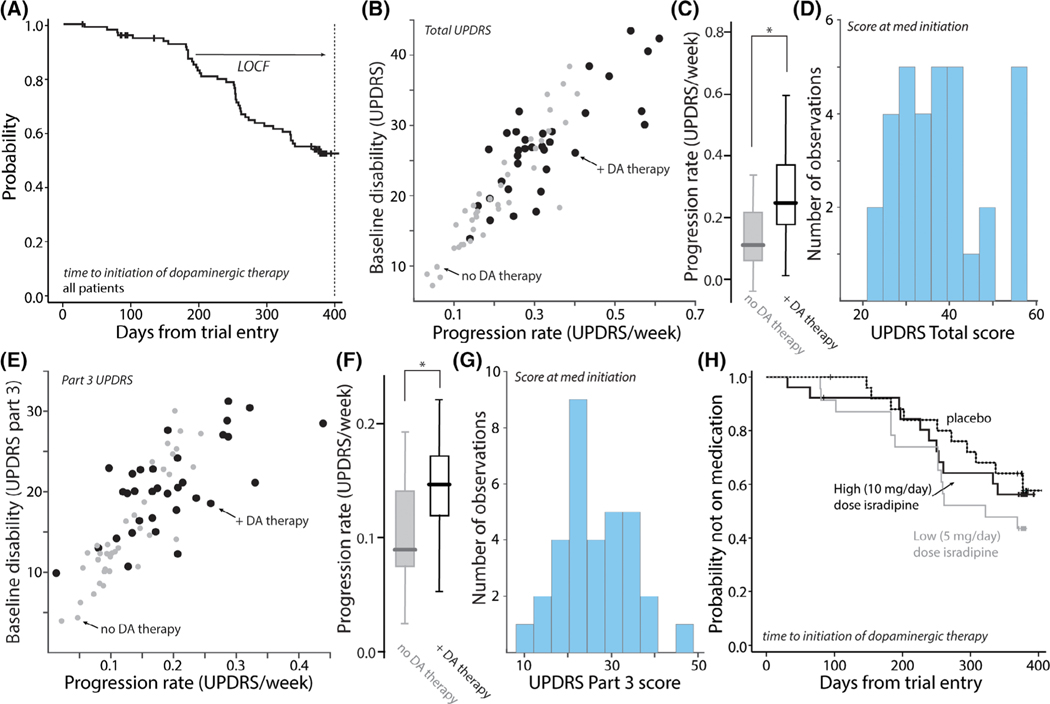
FIG. 2.
Initiation of symptomatic therapy was weakly correlated with total and part 3 UPDRS scores. (A) Kaplan–Meier survival plot of probability of initiating symptomatic therapy as a function of time after trial enrollment. In the initial analysis, the UPDRS scores at conversion were carried forward for the efficacy analysis. This last observation carried forward (LOCF) analysis was not used in our analysis. (B) Scatter plot of progression rate and baseline disability as measured by total UPDRS score. Patients who did not initiate symptomatic therapy during the trial are shown as grey circles (n = 40) and those who did as black circles (n = 35). Although there was overlap in the scores of the two cohorts, patients who initiated symptomatic therapy tended to have a more rapid progression phenotype. (C) Box plots showing the distribution of slopes for the two groups. The slopes of patients initiating symptomatic therapy were significantly greater than those who did not (P < 0.05, t test, n = 40 [no therapy], n = 35 [+DA therapy]); in the box plot the center line is the median, the edges of the box are the interquartiles and the lines mark the ranges of the distributions. (D) Histogram of the total UPDRS disability at the initiation of symptomatic therapy (n = 35). Note the wide range of disability. (E) Scatter plot of baseline disability measured by part 3 UPDRS scores and progression rates for part 3 UPDRS disability. Patients who did not initiate symptomatic therapy during the trial are shown as grey circles (n = 40) and those who did as black circles (n = 35). Although there was overlap in the scores of the two cohorts, patients who initiated symptomatic therapy tended to have a more rapid part 3 progression phenotype. (F) Box plots showing the distribution of slopes for the two groups. The part 3 UPDRS slopes of patients initiating symptomatic therapy were significantly greater than those who did not (P < 0.05, t test, n = 40 [no therapy], n = 35 [+dopaminergic (DA) therapy]). (G) Histogram of the part 3 UPDRS disability at the initiation of symptomatic therapy (n = 35). Note the wide range of disability. (H) Kaplan–Meier survival plots showing that placebo, low and high isradipine treatment groups had similar times to initiate symptomatic therapy (log-rank P = 0.3459).

