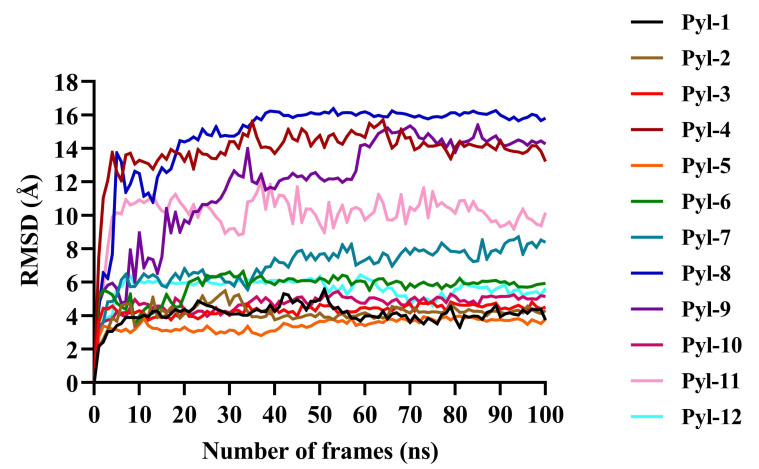
Fig. (4).
Protein Root Mean Square Deviation (RMSD) values for all twelve docked complexes after molecular dynamic simulation studies. The x-axis shows the number of frames (ns), while the y-axis depicts the RMSD values (Å). It was noted that the RMSD peaks reached a constancy towards the end indicating the conformation stability and an appropriate simulation for all docked complexes. The protein RMSD values for all evidenced that the docked complexes were stable and could therefore be used for further studies (A higher resolution / colour version of this figure is available in the electronic copy of the article).

