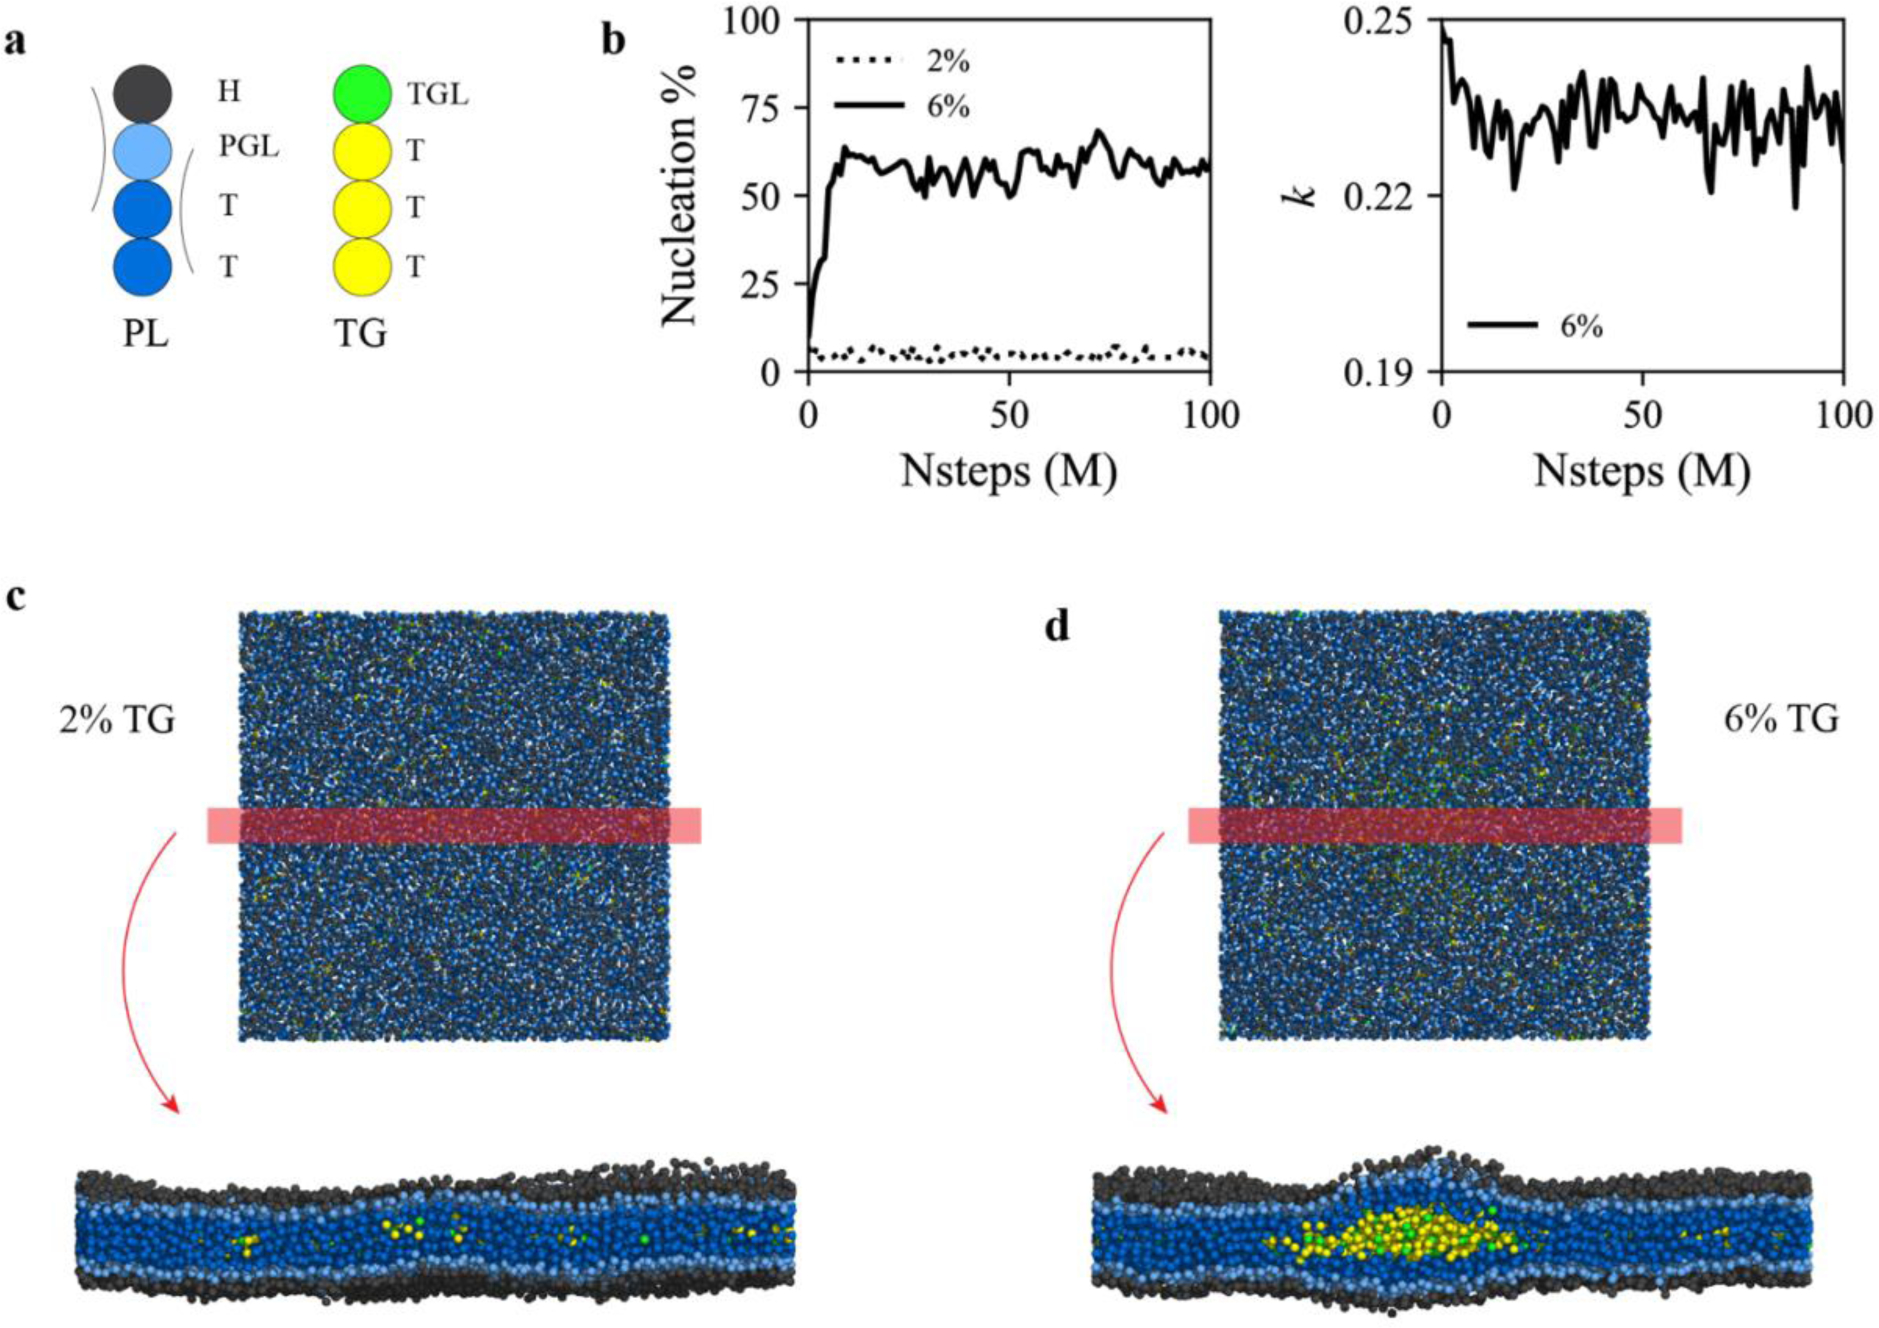
FIGURE 4.

TG concentration-dependent nucleation. (a) Illustration of the PL and TG models used in this study. Each CG type is written next to each CG bead. Arcs represent harmonic angle potentials. The same color code is used in the rest of the study. (b) Nucleation % (left) and anisotropy (right) for bilayers containing 2% mol (dotted) or 6% mol (solid) TG. For visual clarity, anisotropy of the 2% mol TG bilayer is not shown. The last snapshots (100 M MD time steps) of the bilayers containing (c) 2% mol or (d) 6% mol TG are shown. Simulations discussed here were run with an angle potential parameter of 2.0 kBT.
