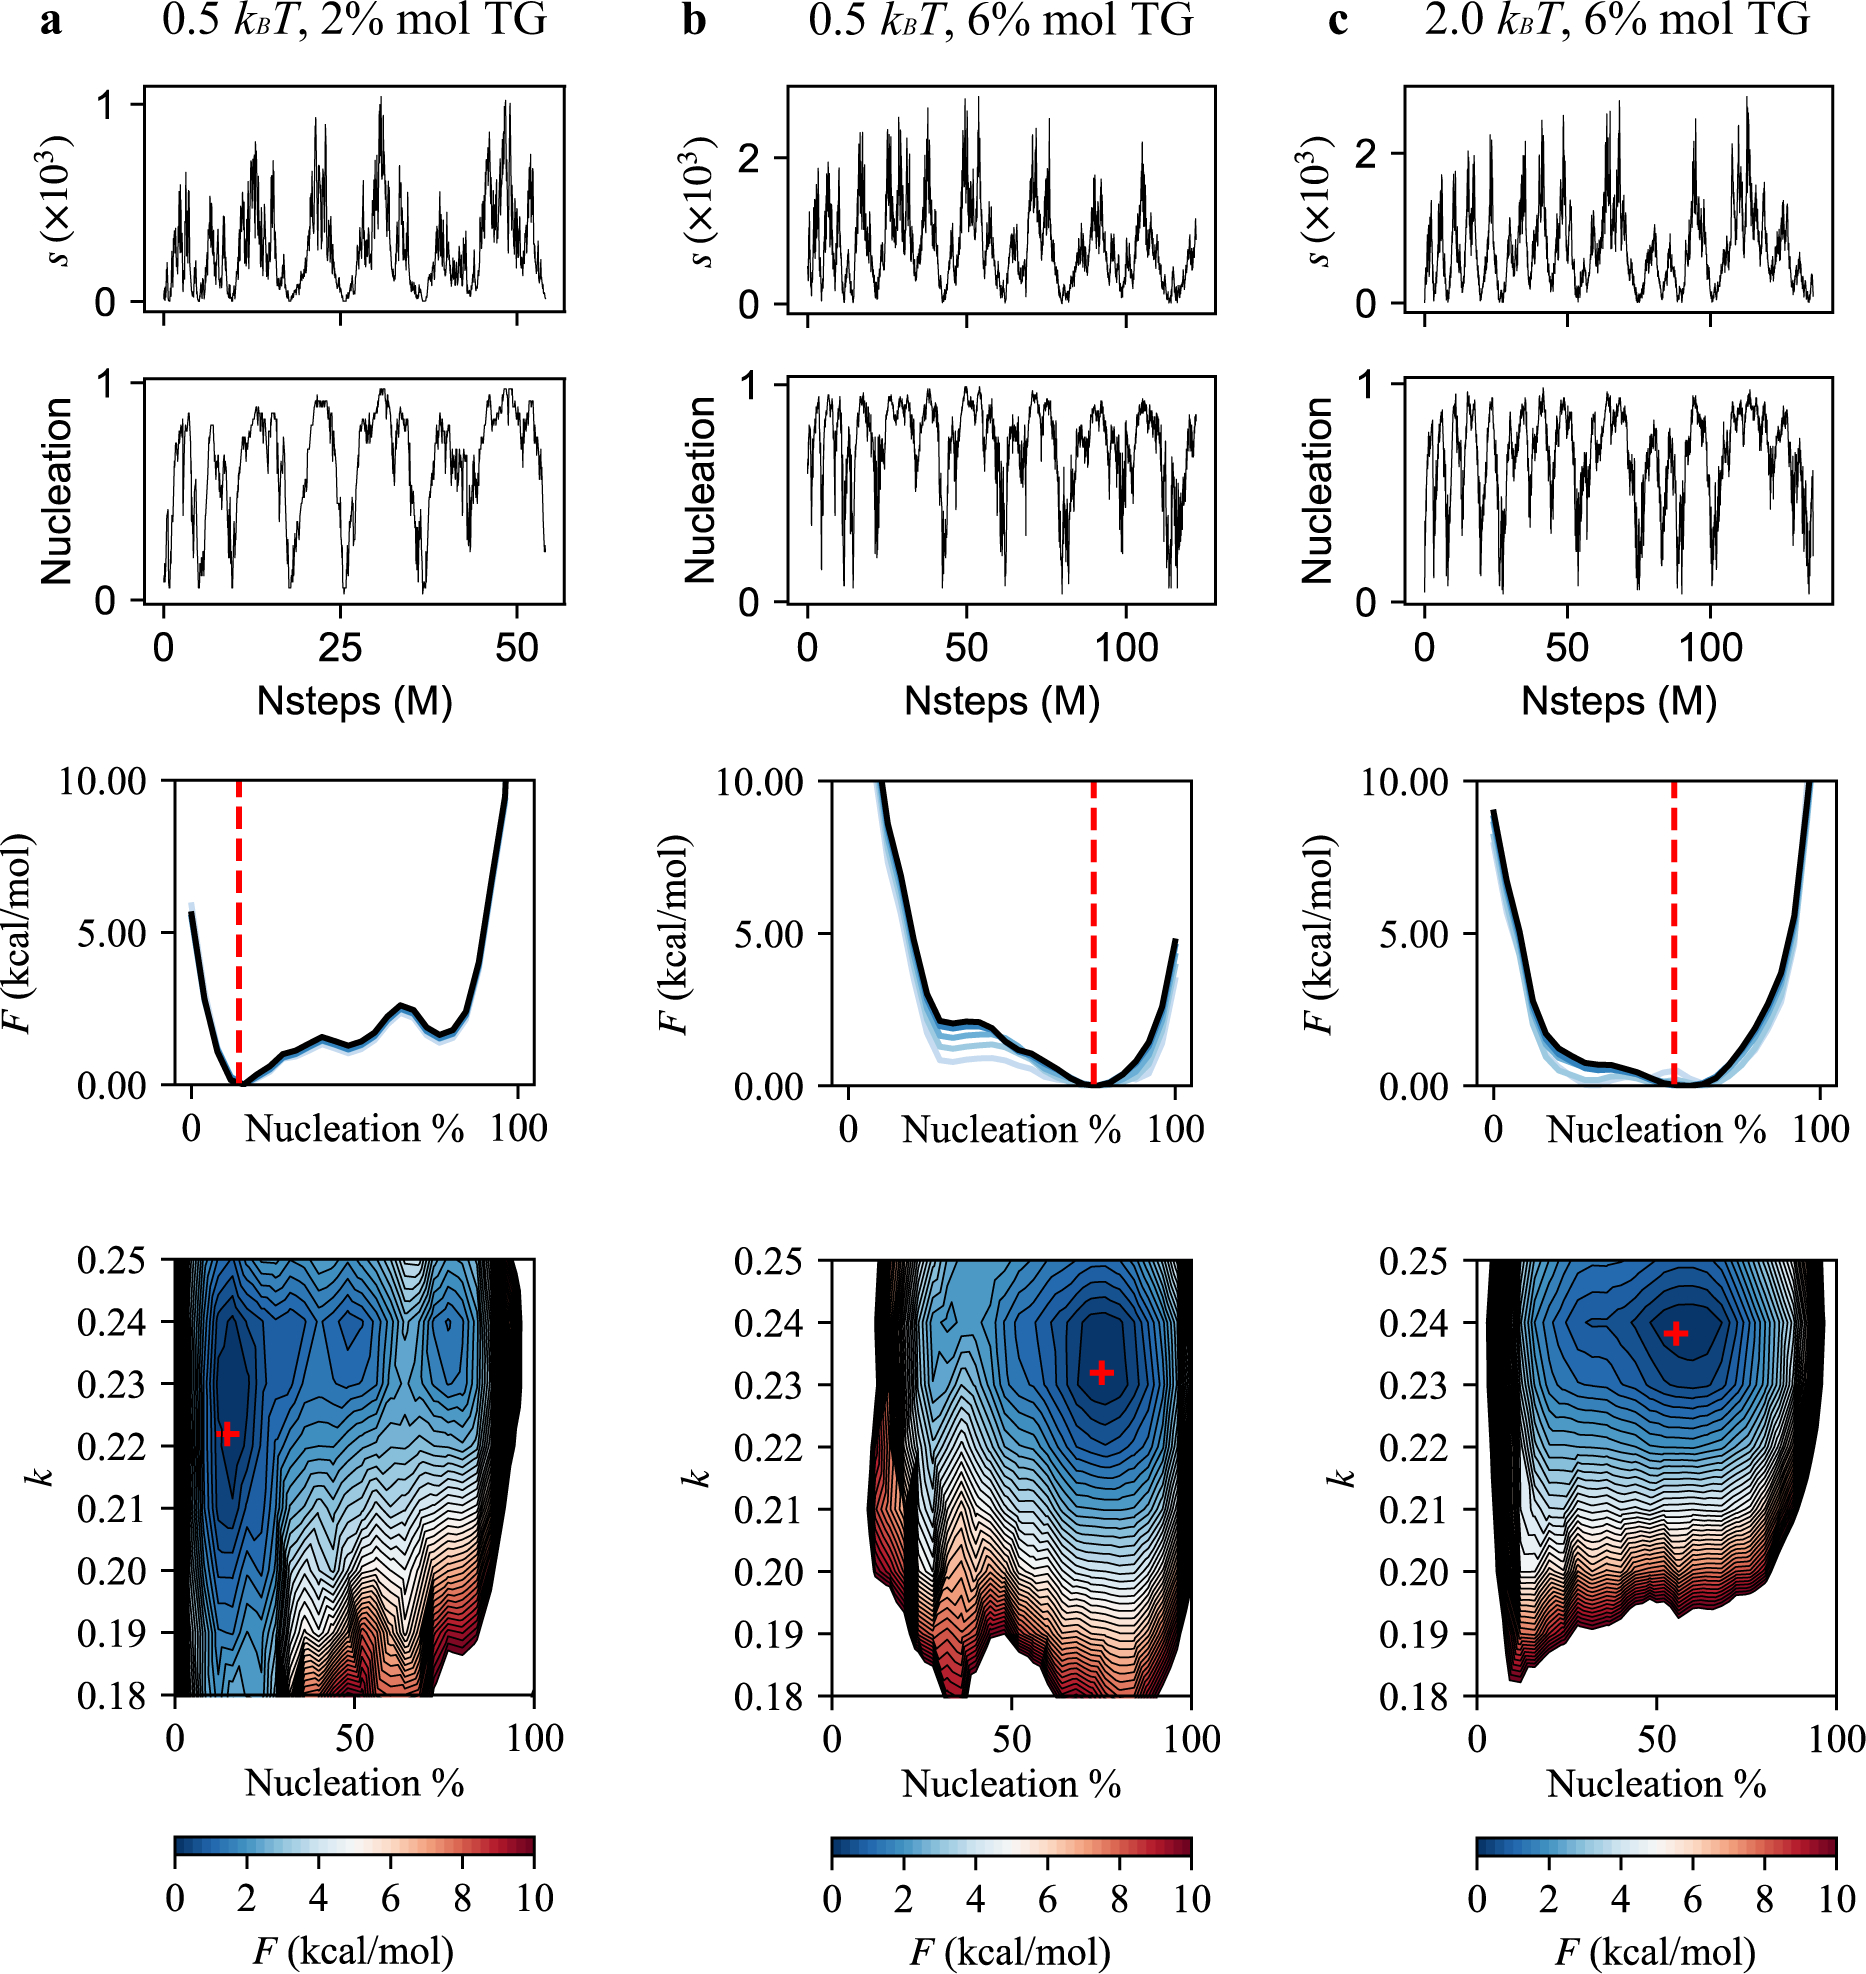
FIGURE 8.

TG nucleation free energy profiles. From top to bottom: (first row) the collective variable in the biased trajectory. (second row) The degree of nucleation calculated in the biased trajectory. (third row) The calculated PMF as a function of the nucleation %. The red dashed line indicates the equilibrated nucleation % value that was obtained from the unbiased simulation of the same bilayer. The blue lines indicate how free energy profiles evolve with simulation times to show convergence. The lighter the color, the less simulation frames were used for calculating the PMF. (fourth row) The calculated PMF as a function of nucleation % and anisotropy. The red marker indicates the equilibrated values of nucleation % and anisotropy from the unbiased simulation of the same bilayer. (a) The simulation was run with an angle parameter of 0.5 kBT and contains 2% mol TG. (b) Angle parameter of 0.5 kBT in the 6% mol TG bilayer. (c) Angle parameter of 2.0 kBT in the 6% mol TG bilayer.
