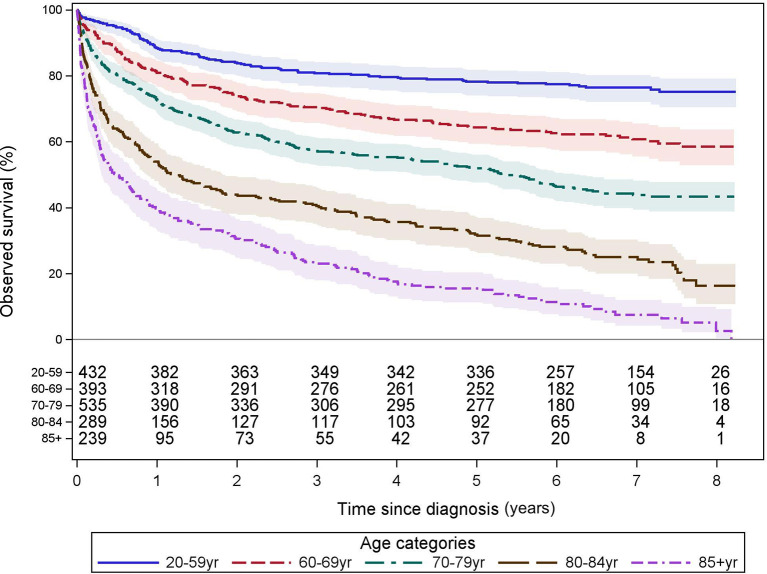
Figure 1.
Observed survival by age categories. These Kaplan–Meier curves show the observed survival from time of diagnosis, of all 1,888 patients, grouped into 5 clinically relevant age categories associated with a significantly different overall survival from time of diagnosis. The numbers of patients at risk are tabled below the curves. Colored areas represent the 95% confidence intervals.

