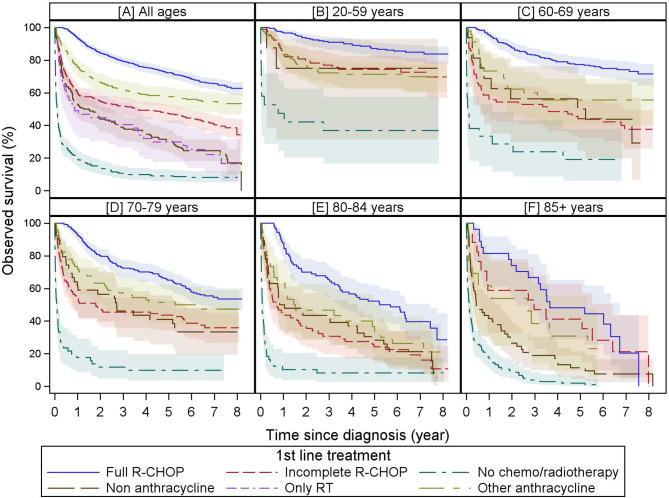
Figure 2.
Observed survival by first-line treatment by age group. These Kaplan–Meier curves show the observed survival from diagnosis stratified by first-line treatment of all patients (A) and stratified by age group (20–59, 60–69, 70–79, 80–85, and 85 years+ in (B–F, respectively). For all age groups, full R-CHOP and “no chemo/radiotherapy” are consistently associated with the best and worst overall survivals, respectively. Immortal time bias is not taken into account as survival is presented from diagnosis and patients have to survive until the end of a treatment to be categorized as having received this treatment. While observed survival in the whole cohort for incomplete R-CHOP, other anthracycline, and non-anthracycline groups are significantly different, this is largely lost when stratified by age except in the oldest age category. Due to low numbers, overall survival for radiotherapy alone is only displayed for the whole cohort. Colored areas represent the 95% confidence intervals.

