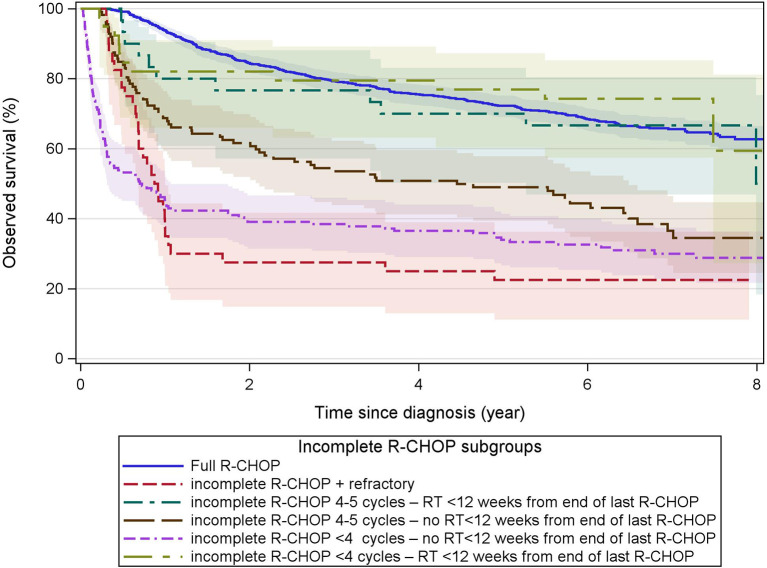
Figure 3.
Observed survival after incomplete R-CHOP. These Kaplan–Meier curves show the observed survival from diagnosis of patients receiving first-line treatment with incomplete R-CHOP (< 6 cycles or < 4 cycles if Ann Arbor stage = I, or CHOP without R) grouped by refractory status (start of any second-line treatment within 12 weeks from the end of first-line therapy), number of R-CHOP cycles, and radiotherapy within 12 weeks from the end of the last R-CHOP cycle. Primary refractory cases had the worst survival. The overall survival of incomplete R-CHOP followed by radiotherapy (green curves) was similar to that of full-R-CHOP. Immortal time bias is not taken into account as survival is presented from diagnosis and patients have to survive until the end of a treatment to be categorized as having received this treatment. Colored areas represent the 95% confidence intervals.

