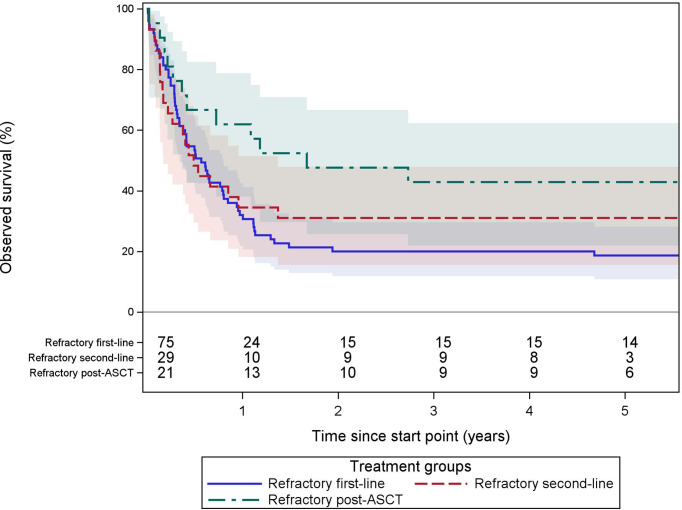
Figure 6.
Observed survival of refractory DLBCL patients. These Kaplan–Meier curves show the observed survival from the start of second- or further-line of therapy stratified in 3 groups. In blue, patients starting any second-line regimen <12 weeks after the end of ≥4 cycles of any first line regimen (n = 75). In red, patients starting a third line regimen <12 weeks after ≥2 cycles of any second-line regimen (n = 29). In green, patients starting any therapy (radiotherapy, chemotherapy, or HSCT) <12 months after start of ASCT (ASCT within 2 years from incidence) (n = 23). The starting point for each group is different and defined as the start of the first (salvage) therapy after becoming refractory. Treatments were only considered during the 2 years of follow-up after for diagnosis. The numbers of patients at risk are tabled below the curves. Colored areas represent the 95% confidence intervals.

