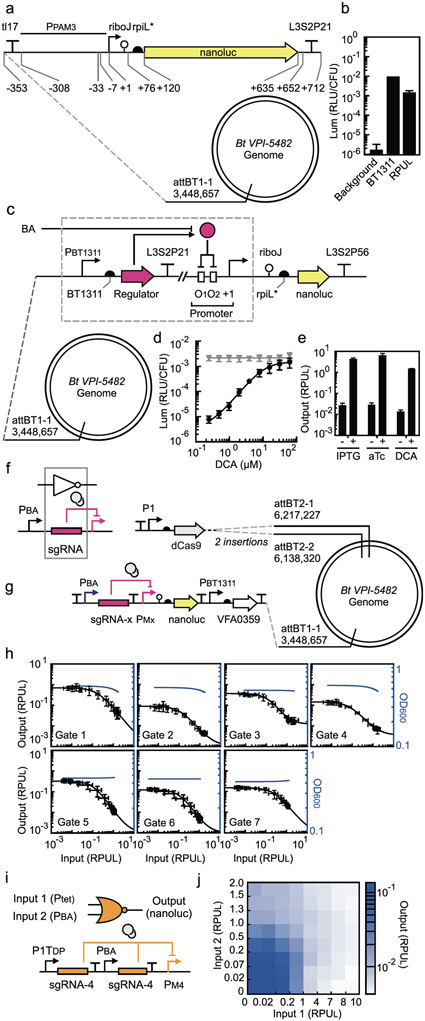
Figure 1: Sensor, NOT and NOR gate characterization in B. thetaiotaomicron.
(a) Schematic of the promoter standard (PPAM3) used to measure RPUL (B. thetaiotaomicron MT768). (b) The luminescence activity of the strong promoter PBT1311 (sourced from ref28) and the background luminescence from B. thetaiotaomicron (strain MT767) is compared to the RPUL standard (Online Methods). (c) The design of the bile acid sensors and its location in the genome (B. thetaiotaomicron MT329) is shown. The “regulator” gene represents the bile acid binding proteins tested and the corresponding operator is placed in two locations in the promoter. (d) The response of the bile acid sensor to DCA is shown (Online Methods). The grey line is the response of the parent promoter PcfxA. (e) The responses of the sensors to no inducer and the presence of inducer (500 μM IPTG, 100 ng/μL aTc, and 62.5 μM DCA) are shown (B. thetaiotaomicron MT770, MT771, and MT772) (Online Methods). These values are used as the inputs to Cello for circuit design. For (a), (b), and (c), the sequences of genetic parts are provided in Supplementary Table S4. The data represent the average of three replicates collected on different days and error bars correspond to the standard deviation between these measurements. (f) The inverter function is performed by dCas9 (grey circles) directed to a promoter by a sgRNA. The output promoter of the bile acid sensor (PBA) is used to characterize gate function. (g) The characterization system for measuring the response functions of NOT gates is shown. dCas9 is constitutively expressed from the P1 promoter. The bile acid sensor is used to turn on the NOT gate (PBA). (Note that the strains also contain the aTc- and IPTG- sensors that are removed here for clarity, see Supplementary Figure S13). Each NOT gate (x from 1 to 7) required the construction of a different strain for characterization: B. thetaiotaomicron MT773-MT775, MT782, MT804-MT806. The sequences of the NOT gates, including all component parts, are provided in Supplementary Table S5. (h) The response function for each NOT gate is shown (Online Methods). The input to the gate is the bile acid sensor induced by DCA (left to right): 0, 0.4, 0.6, 1.0, 1.7, 2.9, 4.9, 8.1, 13.5, 22.5, 37.5, and 62.5 μM. The input (x-axis) is converted to RPUL by separately measuring the activity of PBA for these concentrations (Supplementary Figure S14). The black lines are fits to the Hill function (parameters in Table 1). The blue lines show the impact of gate induction on cell growth (a regression curve is shown, fit to the OD600 data in Supplementary Figure S15). The data represent the average of three replicates collected on different days, and error bars correspond to the standard deviation between these measurements. (i) The “split” design of the gate is shown, where each input promoter drives a separate copy of the same gRNA. (j) The luminescence of the NOR gate is shown as a function of the activity of the two input promoters. The bile acid sensor was converted from μM DCA to RPUL as described in part (h) (bottom to top, 0, 0.9, 1.9, 3.9, 7.8, 15.6, 31.25, 62.5 μM DCA). The second input was induced by aTc and converted to RPUL similarly (left to right, 0, 0.4, 1.0, 2.6, 6.4, 16, 40, 100 ng/μL of aTc) (Supplementary Figure S19). The data represent the average of three replicates collected on different days.

