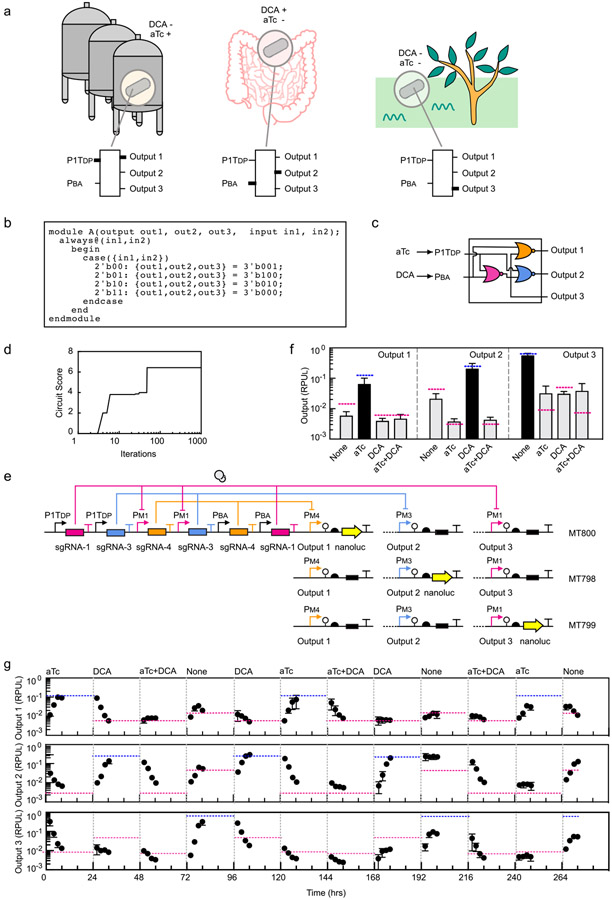
Figure 3: A circuit designed to integrate two sensors and control three programs of gene expression.
(a) The hypothetical inspiration for the circuit design is illustrated (see main text). An output promoter for each combination of inputs allows different genes to be expressed under these conditions. The thick lines in the circuit indicate when the input promoters (aTc, P1TDP; DCA, PBA) or outputs are on. (b) The Verilog specification of the truth table corresponding to the desired logic is shown. (c) Logic minimization algorithms identified the circuit diagram to produce the desired truth table using NOR gates. (d) The simulated annealing run in Cello assigned sgRNAs to each gate. The best set found are shown in part c. (e) The circuit was constructed as specified and inserted into the genome at the same position as shown in Figure 2d. The same sensors and dCas9 cassette are inserted into the attBT2-1/-2 sites (Supplementary Figure S20). Three strains were constructed to report on the three output promoter activities (Output 1, Bt MT800; Output 2, Bt MT798; Output 3, Bt MT799). The black box indicates that the sequence was replaced with a null ATGTAA for promoters that are not being measured. (f) Outputs of the 2-input 3-output circuits are shown. The predicted values for the three outputs are shown as blue (high) or red (low) lines. The inputs are the presence or absence of 100 ng/μL aTc and 62.5 μM DCA. The bars show the experimentally measured outputs expected to be low (grey) or high (black). The data represent the average of three replicates collected on different days and error bars correspond to the standard deviation between these measurements. (g) A timecourse is shown where the circuit is switched between states over more than two weeks (Online Methods). Each of the outputs was measured using the three reporter strains. The grey lines indicate when the transitions between inducer combinations occurred and the concentrations used are the same as above. The blue and red dashed lines are the steady-state values predicted by Cello for each combination of inputs.

