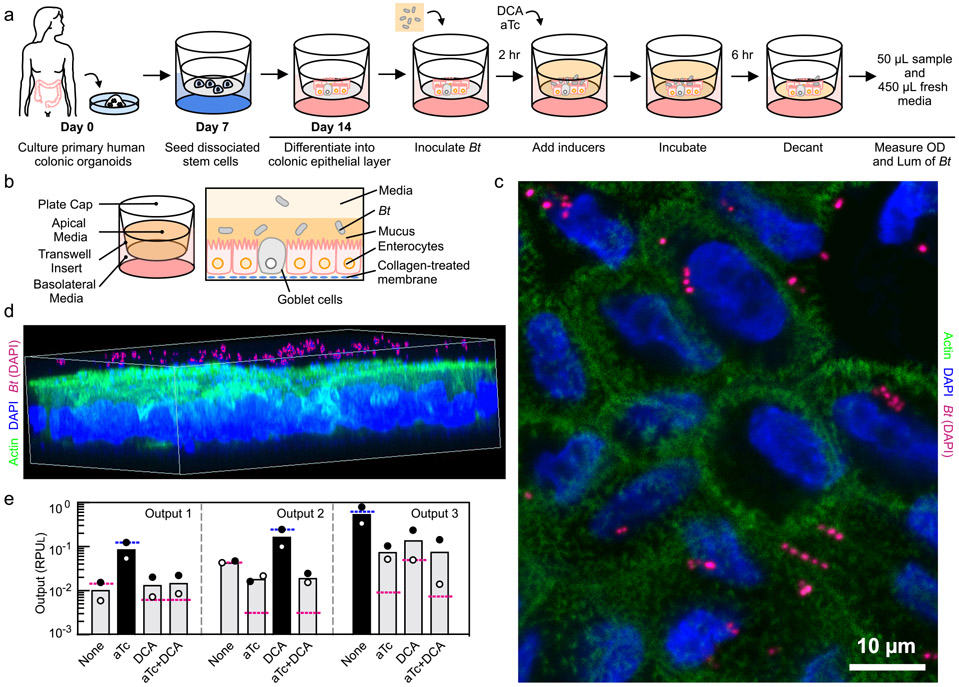
Figure 4: Coculture of B. thetaiotaomicron with colonic epithelial monolayer.
(a) Schematic description of the steps to perform the B. thetaiotaomicron (MT798, MT799 and MT800; see Table S2) and colonic epithelia coculture experiment (Online Methods). (b) An illustration of the human colonic epithelia and B. thetaiotaomicron co-culture system. (c) Top view of the monolayer stained with DAPI (blue) and anti-Actin (green). B. thetaiotaomicron was false colored from blue to pink to highlight their location (see Supplementary Figure S21 for original image). (d) 3D rendering of the monolayer stained with DAPI and anti-Actin (See Supplementary Figure S22 for original image). (e) Outputs of the 2-input 3-ouput circuit harbored by B. thetaiotaomicron co-cultured with human colonic epithelia are shown. The predicted values for the three outputs are shown as blue (high) or red (low) lines. Inputs are the presence or absence of 100 ng/μL aTc and 62.5 μM DCA. The bars show the experimentally measured outputs expected to be low (grey) or high (black). The data represent the average of two replicates collected on different days and white/black circles correspond to each measurement.

